Tableau Usage Analyzer (TUA)
Infolytik has developed a product called the Tableau Usage Analyzer – a free monitoring tool that tracks concurrent usage and user activity in real time. It can be installed and set up and running in seconds and help business analysts understand license usage, capacity planning, and activity trends for their Tableau system to make quick and informed decisions for growth, cost optimization, and more.
Don't have it yet? Download it now! Just submit your request at: https://www.infolytik.com/contact/
We will send you a link, otherwise use the link you received in your email from us or LinkedIn to receive your download.
Questions to Answer
- How many users are on my Tableau Server RIGHT NOW?
- How do I track IP origin in real time?
- Is there a way to measure true concurrency and not just log ons/log offs in Tableau?
- Am I paying more for Tableau than I should?
- Do we need to expand our Tableau platform due to high growth rates?
- Is Tableau adoption increasing or decreasing over time?
TUA Installation
TUA is free and at your fingertips – just download it from this link, receive the free tool and then dive right into your use cases in the following chapters.
UI Overview
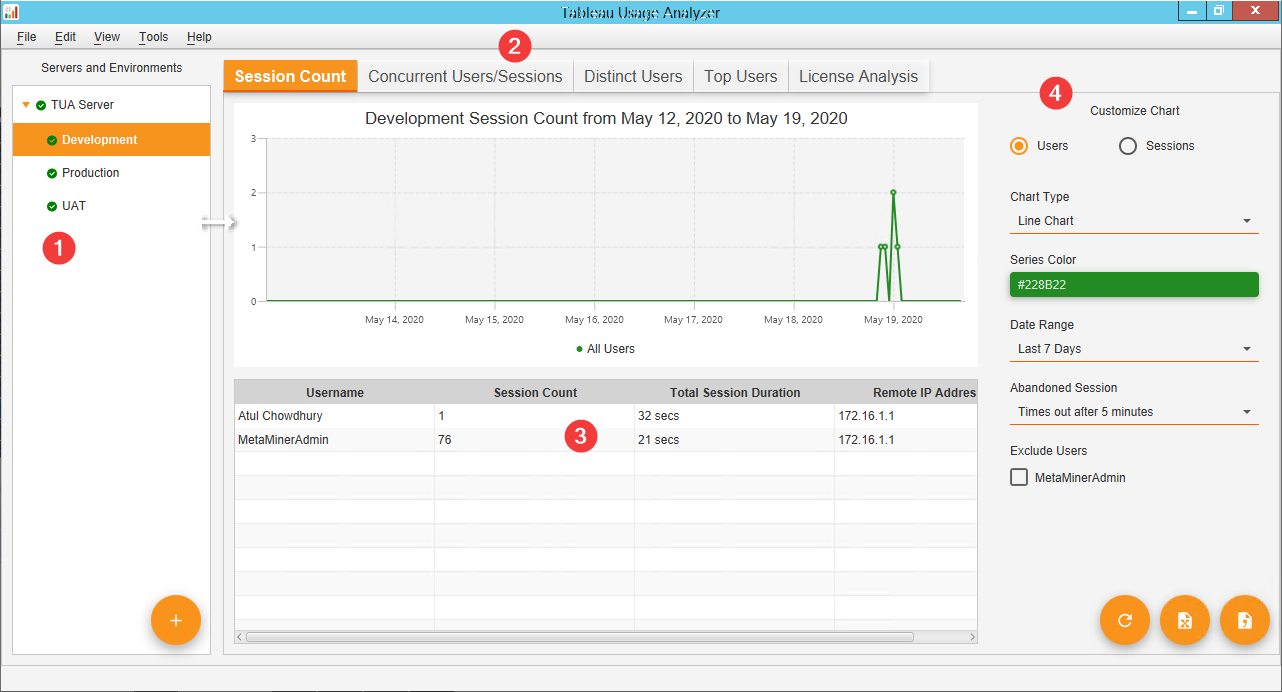
Once TUA launches, the first thing to do is establish a connection to the TUA local data server. The image below shows the 4 key areas of Tableau Usage Analyzer:
- Environment connection manager
- Analysis tabs
- Usage details
- Chart options
Session Count
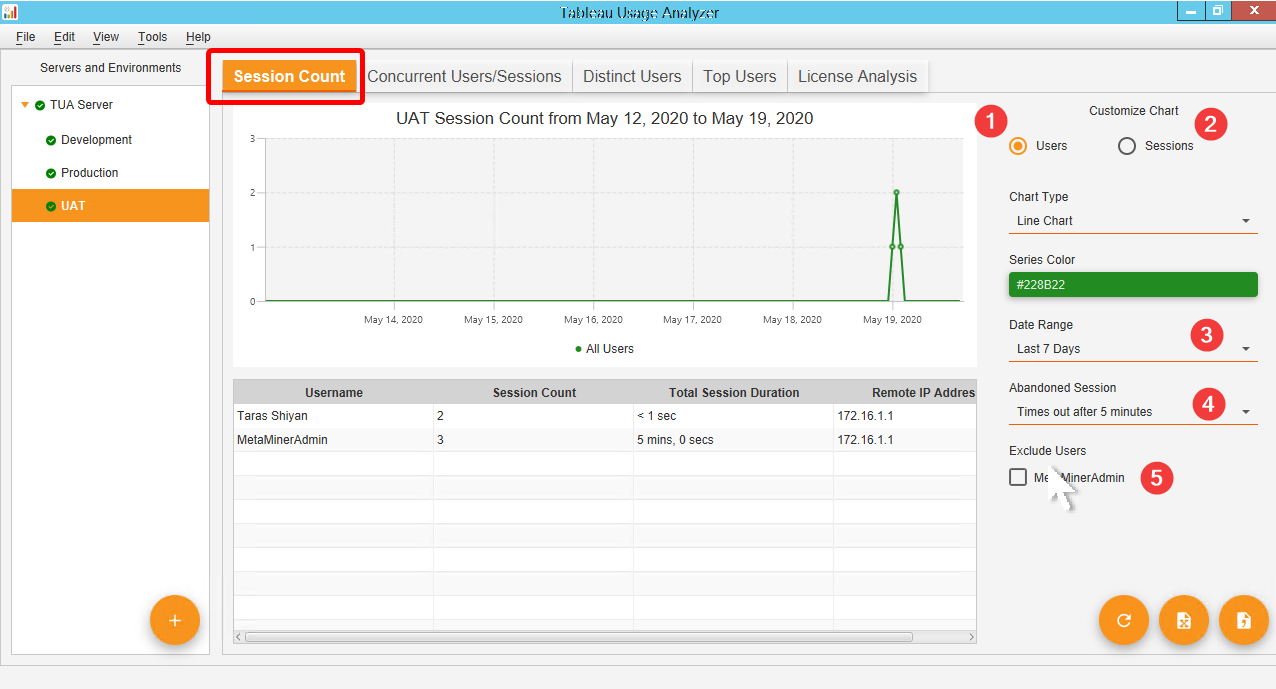
A chart describing how many Sessions or Users are utilizing the Tableau server per hour.
The annotations in the graphic below are described as follows:
- View session data by distinct USER NAME per hour of each created session
- View session data by distinct SESSION ID per hour of each created session
- Show session information in this many recent days. The longer history, the longer it may take to render this view.
- Use this selector to indicate how many minutes TUA should assume a user remains inactive until their session is considered terminated. This helps limit unwanted session counts due to orphan or never-terminating sessions.
- Exclusion filter to remove any account from statistics like admin or powerusers.
Remote IP Tracking for CyberSecurity
Do you know where your Tableau users are logging in from? With TUA you can immediately discover the originating IP address of the user login as well as see if a user is logging in from multiple IP addresses frequently, which can sometimes indicate re-use/sharing of user credentials (and a security breach incident to be alerted of).
Concurrent Sessions
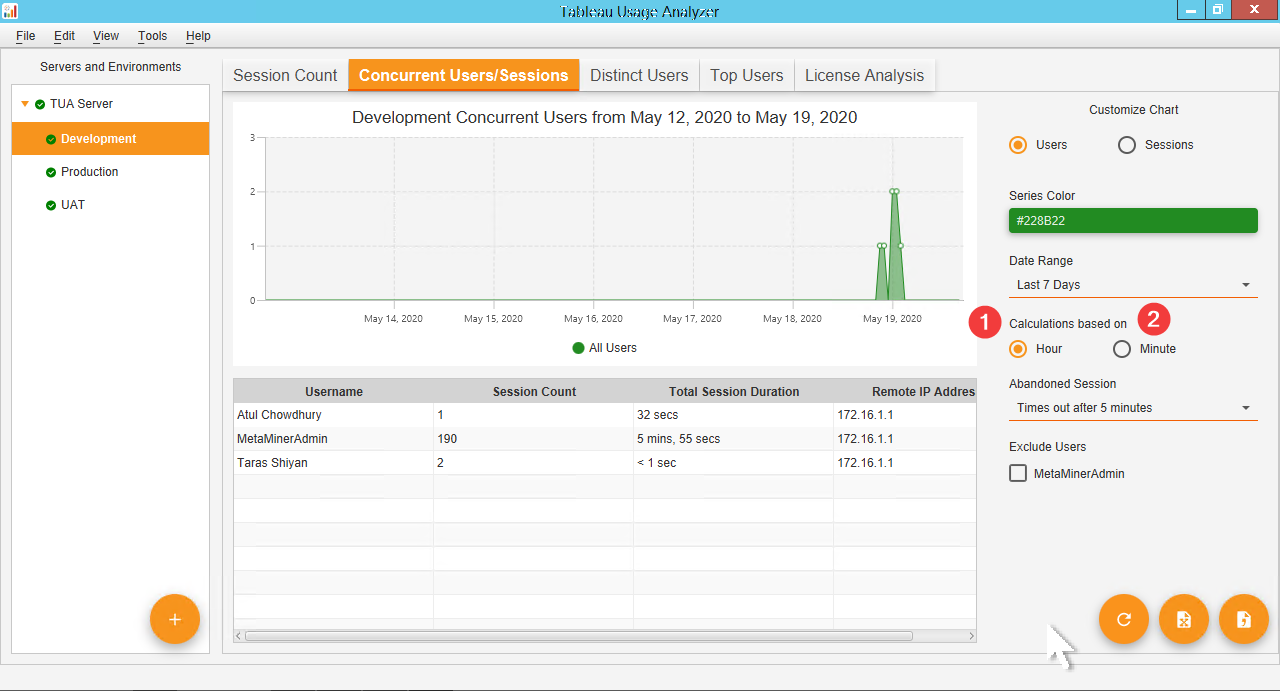
One unique aspect of the Tableau Usage Analyzer is to accurately capture a true picture of when users are concurrently accessing Tableau in terms of truly overlapping user sessions. This is different from users simply accessing Tableau by logging on/off over the course of the day, as concurrency measures capacity and licensing needs more clearly.
The screen illustration has a special annotation to intepret hour vs minute based, describe as follows:
If hour is chosen, then TUA analyzes user log ons:
Distinct Users
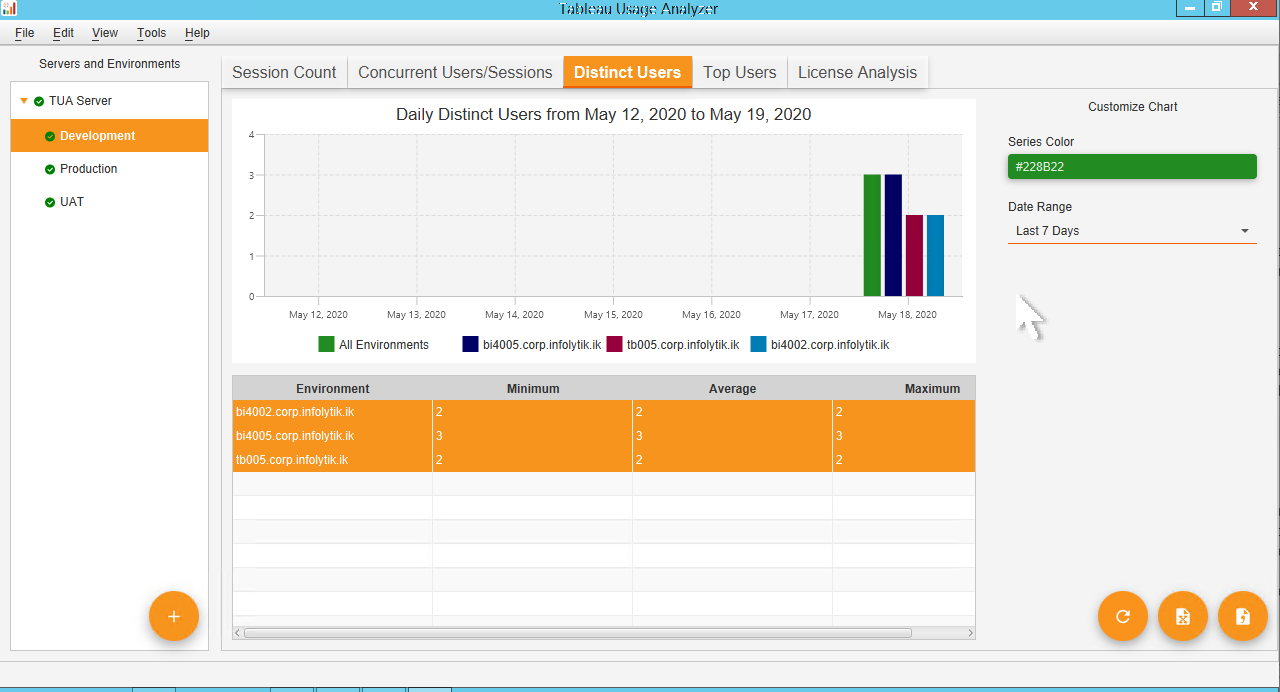
There are several user cases where we want to measure usage across systems: For example, if our company is moving from on-premise to AWS, it's useful to see how many users are adopting one system vs. the other -- or just to simply see and daily chart of min/max/average users logging onto the system.
Top Users
Who are your power users? Do they have subject matter expertise you can tap into or inspire an internal user group around to share thoughts and best practices? This chart quickly provides those figures as well as the least active users of the system.
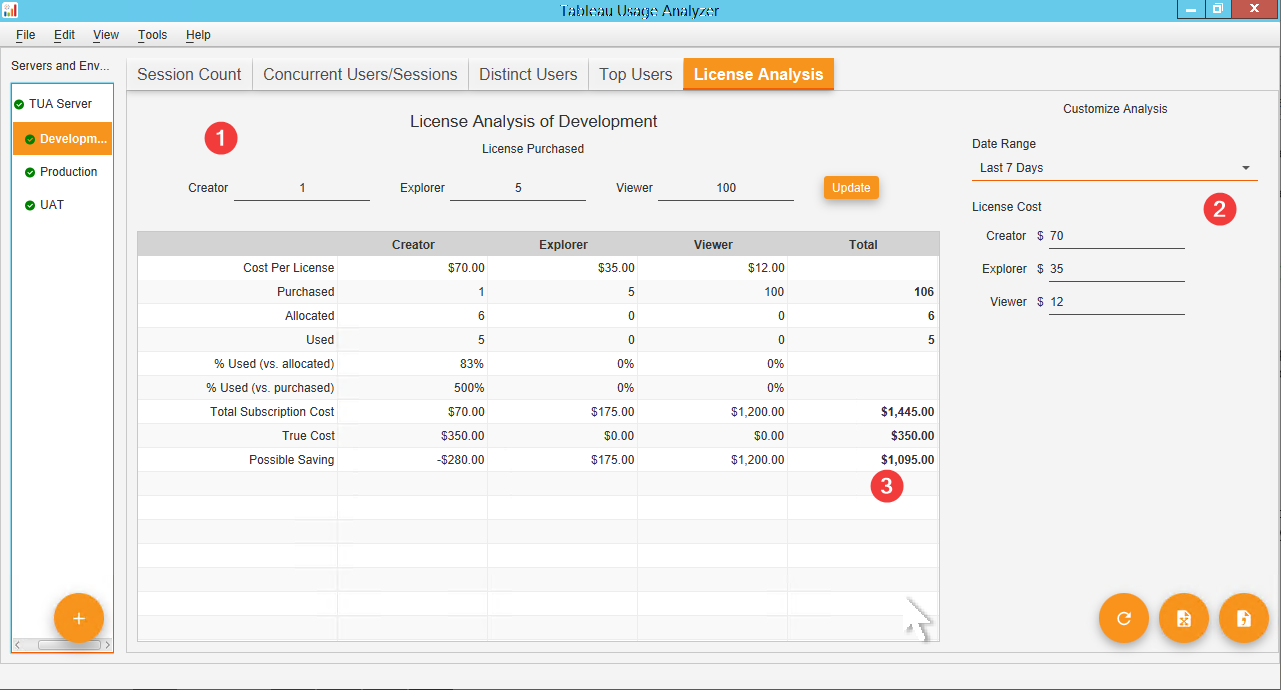
License Analysis
Perhaps one of the most exciting features of TUA, the license cost analyzer provides immediate insight into your license utilization and cost structure for Tableau user-based licensing.
For example: You may have purchased 200 viewer licenses and 100 creator licenses, yet, upon further examination you see that only half of those are being used or allocated.
If the total cost if running $5000/mo. - why not reduce it in half, or $2500? Tableau license analyzer helps you do just that and provides free-entry fields so you can adjust your own licensing parameters on-the-fly.
- Dynamic license entry values (how many licenses of each type did you buy?)
- How much did you pay for the licenses? (defaulted to current pricing from Tableau)
- How much can you save per month based on your usage metrics?
Allocated and Used Rows
The allocated row values are computed by looking at the number of site users who have been granted a license in Tableau Enterprise The used row values reveal how many users are actually logging onto the sytem with that license to use it.of).
FAQ
Have questions? Don't be shy – we want to hear from you, whether it's usage, an enhancement request or just about anything you may want to ask!
Mail us at support@infolytik.com
Need more heavy duty Tableau Enterprise Management for migrations, metadata, monitoring and dashboard testing and other bulk administration needs? Try MetaMiner Enterprise from Infolytik and see what all the buzz is about!