Tableau IA – How It Works
This topic describes how the Tableau IA additional tab works.
There is a typical step-by-step process:
-
Select one or more business objects in Tableau Explorer, or click any question in Tableau Finder.
For example, select your Default site of your main environment in Tableau Explorer and choose View Impacted Objects... in the context menu:
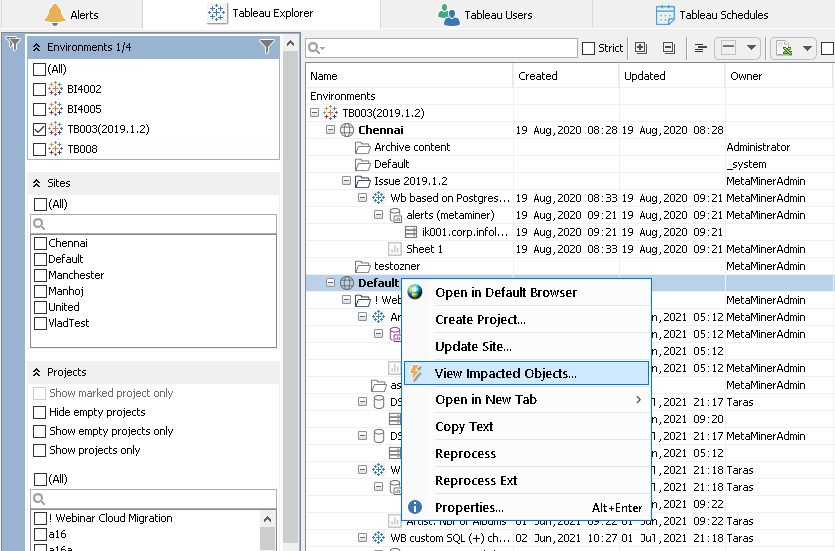
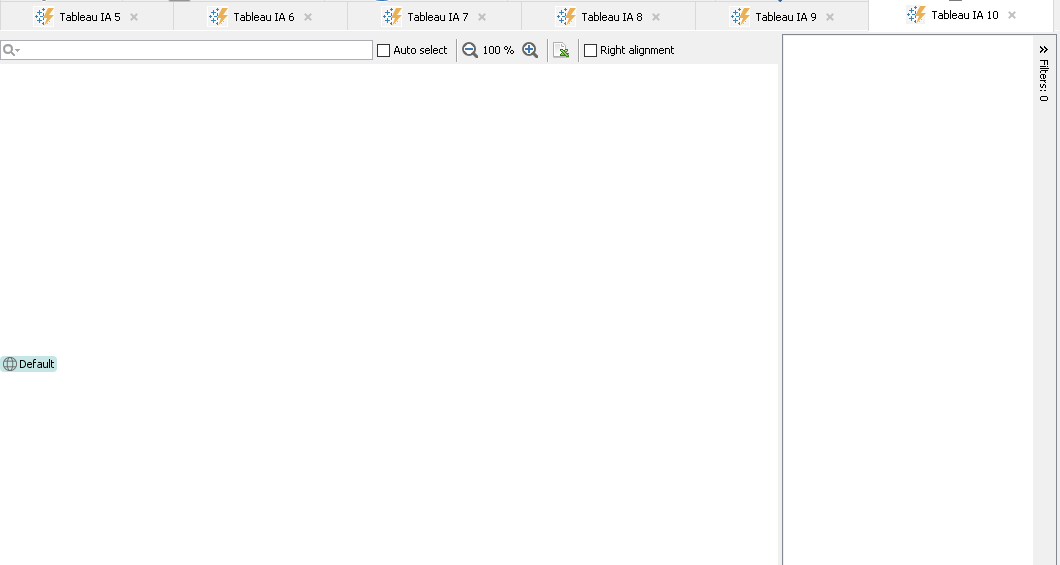
Finally, the Tableau IA tab opens.
Initial picture is displayed:
-
Right-click the Default site in the graph to open the context menu:
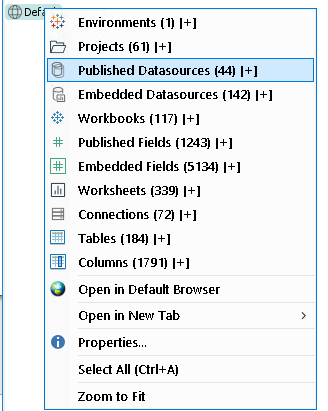
There are several items at the top of the context menu, from Environments (1) to Columns (1791), which indicate business objects impacted by changes to the selected Default site. One item for one object type. The number in brackets (1791) shows how many impacted objects of this type (Columns) are found.
-
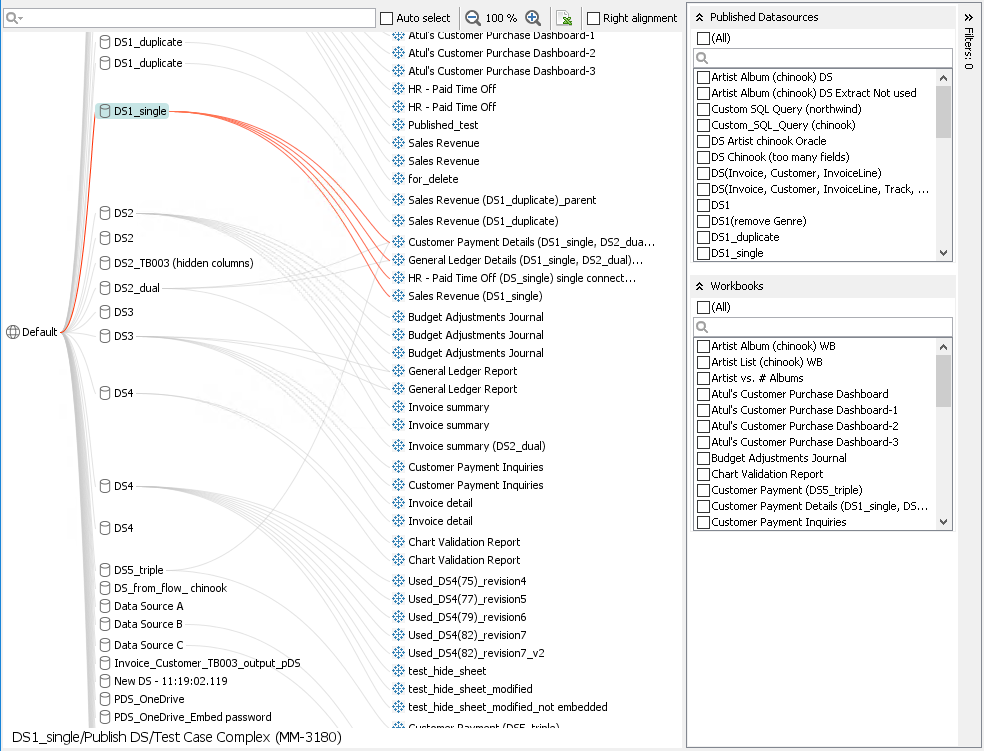
For example, you choose Published Data Sources (44). Then, 44 related objects appear in the content area:
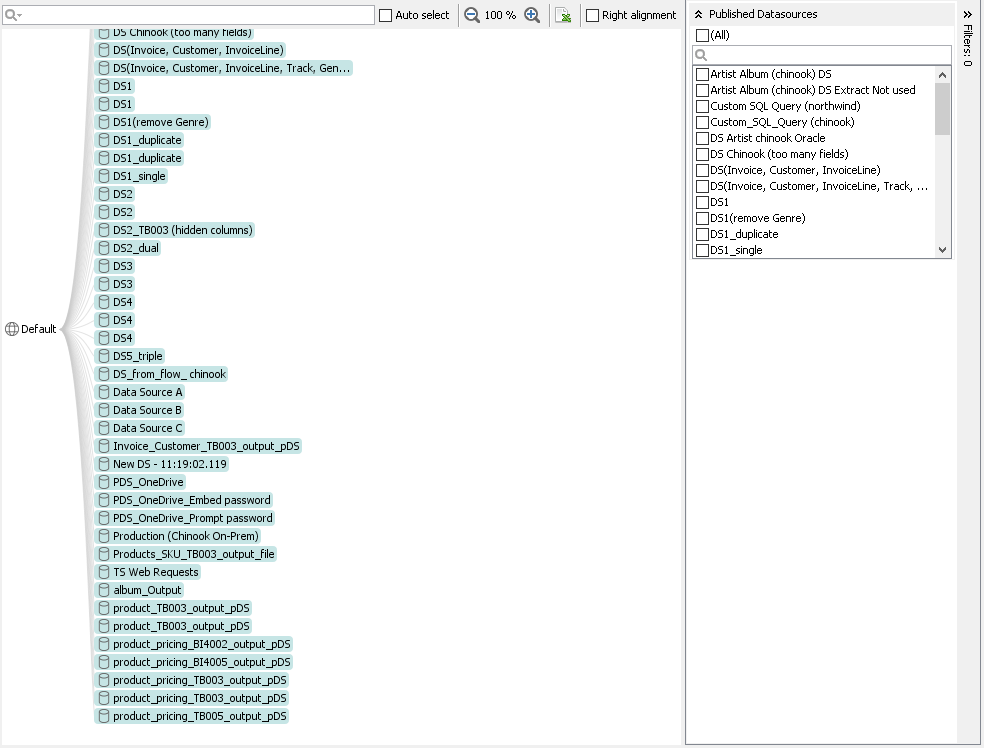
The new filter group Published Data Sources appears in Filter Pane.
-
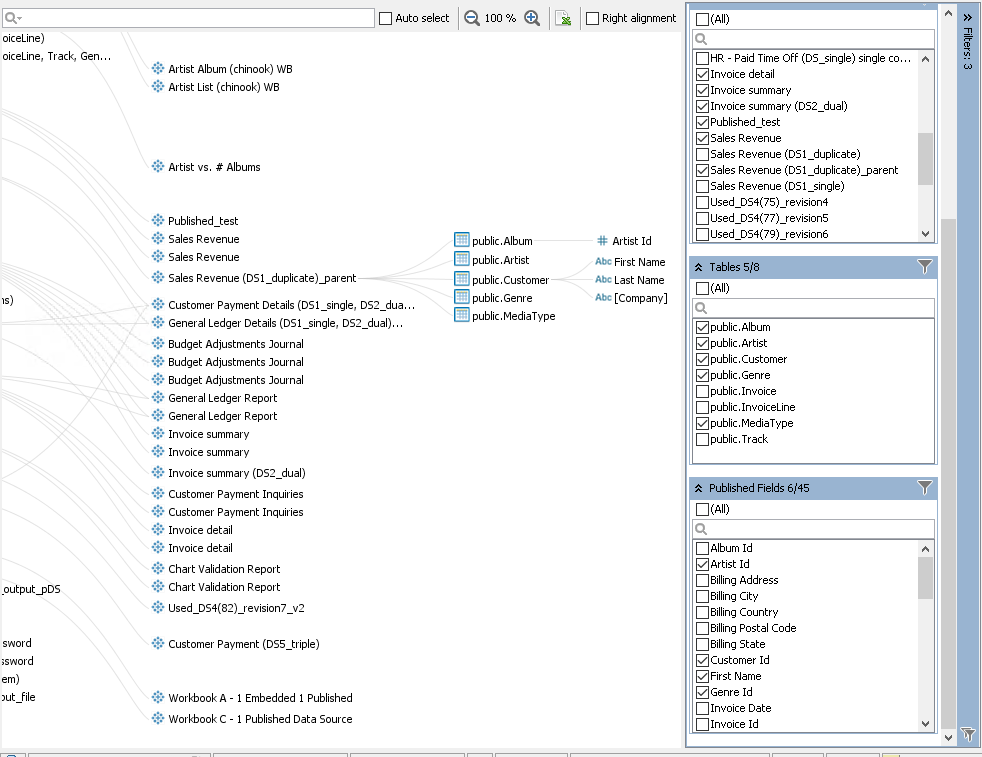
Now, right-click some published data source to open its context menu. You see a new set of objects, related to your data sources. For example, you choose Workbooks.
Then, a new layer of related objects appears in the content area and the new Workbooks filter group:
-
You can add as many layers of related objects as you wish.
-
When all required layers are added, you may want to hide not important information. For this, apply filters by choosing only those object names you wish to display in the Filter Pane:
-
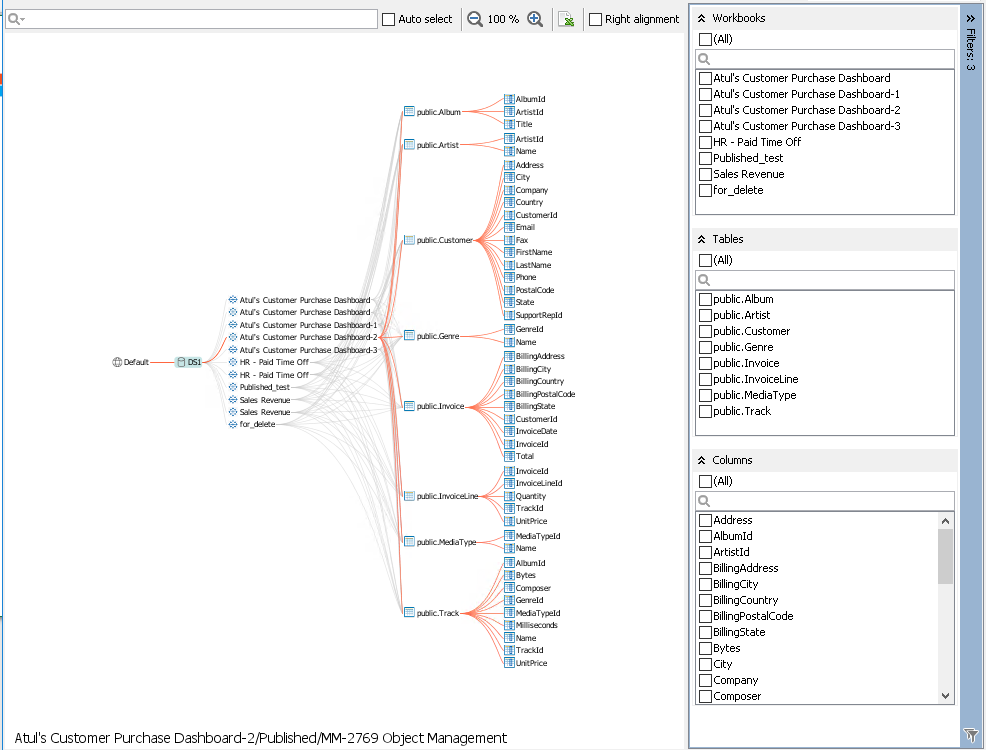
Another tool to hide unnecessary information is Hide Unrelated. Choose a published data source (e.g. DS1) you definitely need, right-click it, and choose Hide Unrelated in the context menu.
After this action, only objects related to the selected data source on lower layers and objects to which the selected data source is related itself will remain. All other objects will become hidden:
-
Then, let's zoom our final graph to fit the content area. Click anywhere and choose Zoom to Fit in the context menu.
Tableau IA will zoom and center the graph for better look:
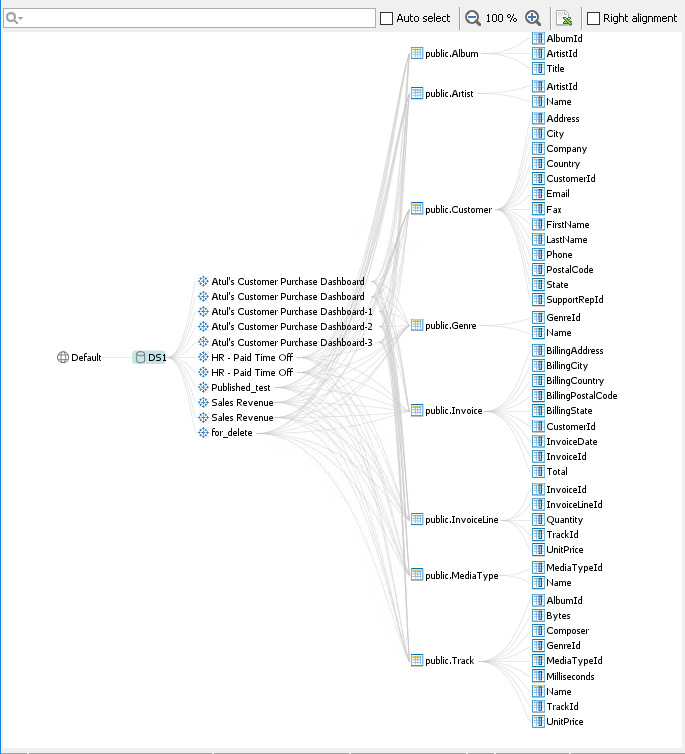
Now our graph looks the best way that allows us to recognize the impact your important business objects have one on another.
-
Finally, export the final set of objects to a CSV by clicking
 in the toolbar. MMTE generates a
 CSVfile and opens it in your default CSV editor, for example, in Microsoft Excel: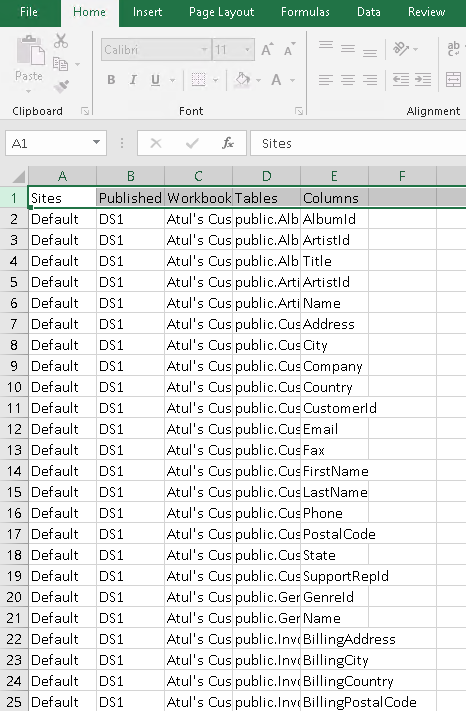
See Also