Visual Diff – Overview
The ![]() Visual Diff application tab in MMTE Client is an advanced tool to find differences between two environments or any other two similar pieces of your BI data, and then display differences in a visually comprehensible way. Visual Diff allows users to compare any two BI hierarchy branches to examine structural differences during migrations, import, or upgrade:
Visual Diff application tab in MMTE Client is an advanced tool to find differences between two environments or any other two similar pieces of your BI data, and then display differences in a visually comprehensible way. Visual Diff allows users to compare any two BI hierarchy branches to examine structural differences during migrations, import, or upgrade:
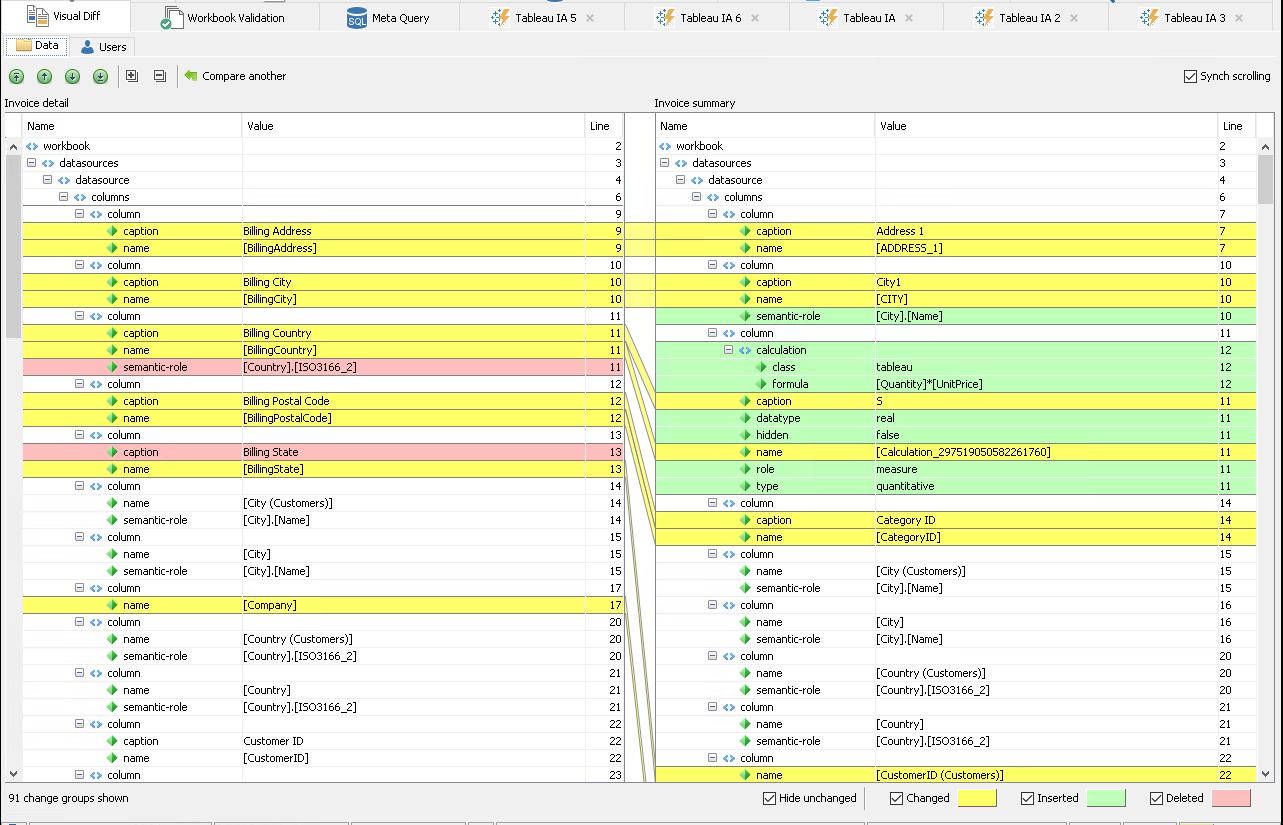
The Visual Diff tool performs a deep comparison of the structure and/or content of two pieces of your BI data between two different environments or within the same environment and presents the changes in a visual, easy to analyze manner.
Modes
Visual Diff in MMTE works in two modes:
- Data mode
- Users mode
Why would I use it?
During a migration or upgrade, it is useful to know what content has successfully moved across and to gauge content integrity.
For example, imagine you just completed a partial migration of 10 projects from a Tableau 10.4 environment to a Tableau 2021 environment. You would like to determine the differences between these two environments.
While you use Visual Diff for checking the global structure of your BI landscape, inner structure of key BI assets, and user management configuration, you use Workbook Validation for checking data processing integrity and performance measurement.
There is another difference in how you use these two application tabs. Visual Diff is designed for manual operation and for maximum visualization of comparison results in its UI. Workbook Validation is optimized for running regularly and automaticly, when you configure once what you need to control, and then, while you and your team edit your data, get brief notifications, daily or hourly, about data integrity and consistency updates.
The Visual Diff tab provides several solutions for comparing your BI data:
- Compare two sub-trees (environments, sites, projects) in Data Mode
- Compare two objects (workbooks, data sources, flows) in Data Mode
- Compare two user groups (environments, sites, groups) in Users Mode
For tree structures, projects, sites, and environments Visual Diff shows differences between inner structures and nodes.
For business objects (workbooks, data sources, flows) Visual Diff shows differences in their internal data.
For user groups, Visual Diff shows which user accounts are common and which are not.
Visual Diff Tab UI
There is a bar with two tabs to switch between modes. It is located on top of the Visual Diff window:
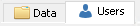
- Users: for comparing user groups
- Data: for comparing other BI assets
Data and Users modes work independently, so you can have two comparisons running simultaneously in your MMTE Client.
In both modes (Data, Users), the Visual Diff tab UI has two absolutely different states:
- Initial View state, where you select targets to compare, and
- Difference Visualization View state, where you browse differences between targets.
If you have a mixed BI landscape with both SAP BO CMS and Tableau environments, then a new switch appears at the bottom of Visual Diff:
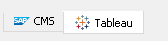
Visual Diff processes SAP BO CMS and Tableau environments separately.
Filter Pane is not displayed in the Tableau mode.