MMTE Server Logs
LOGBack configuration for MMTE Server is specified by the Dlogback.configurationFile MMS vmarg system variable.
Its default value is MetaMinerServer.logback.xml
By default, the most of MMTE Server logs are stored in <METAMINER INSTALLATION DIRECTORY>\server\logs, but you can define alternative locations by changing MetaMinerServer.logback.xml, all paths in this file are relative to the <METAMINER INSTALLATION DIRECTORY>\server directory.
Clients Activity Log
This is the log of user actions: login attempts, connects, disconnects, and so on.
| Appender | CLIENTS-ACTIVITY-FILE |
| Config | MetaMinerServer.logback.xml |
| Default Output | file |
| Default Filename | clients-activity.log |
| Default Level | DEBUG for MetaMiner modules, WARN for others |
| Default Rotation/Retention | max 10MB, max 90 days |
| Default Encoder (format) | %date{dd.MM;HH:mm:ss.SSS} [%thread] %-5level %logger{35} - %msg%n |
Example:
24.09;01:47:20.110 [nioEventLoopGroup-3-8] DEBUG com.infolytik.server.service.Zaq - User john (session 1/e81a1682-9c21-4d59-95cc-3ae1d2b93c33) disconnected
24.09;01:47:20.224 [nioEventLoopGroup-3-10] ERROR com.infolytik.server.service.Zh - Login attempt from /127.0.0.1:63731 failed (user or password is null): user=null, pwd=null
24.09;01:47:20.733 [nioEventLoopGroup-3-11] WARN  com.infolytik.server.service.Zh - Login attempt from /127.0.0.1:63767 success: user=hanna,pwd=***, session=2/7924d09b-6037-44ce-a6f9-be6276be9392
24.09;01:48:05.391 [NettyConnector Service Thread-1] DEBUG com.infolytik.server.service.Zdg - User maria (session 2/7924d09b-6037-44ce-a6f9-be6276be9392) from /127.0.0.1:64218 is executing method getAlerts
Diagnostic Log
This is a special log for disaster events like "MMS cannot connect to MMDB". Normally, it is empty.
| Appender | DIAGNOSTIC-FILE |
| Config | MetaMinerServer.logback.xml |
| Default Output | file |
| Default Filename | diagnostic.log |
| Default Level | DEBUG |
| Default Rotation/Retention | max 10MB, max 90 days |
| Default Encoder (format) | %date{dd.MM;HH:mm:ss.SSS} [%thread] %-5level %logger{35} - %msg%n |
Garbage Collector Log
The log for Java Garbage Collector (GC) of MMS JVM. Optional.
| Config | MetaMinerServer.ini |
| Variable | Xloggc |
| Default Filename | gc-<timestamp>.log |
| Default Rotation/Retention | max 10MB, max 40 volumes |
| Format | {Heap before GC invocations ... DATETIME ... Heap after GC invocations ... } |
Example:
{Heap before GC invocations=36 (full 5):
 PSYoungGen      total 2491904K, used 2398394K [0x0000000715580000, 0x00000007be580000, 0x00000007c0000000)
  eden space 2248704K, 100% used [0x0000000715580000,0x000000079e980000,0x000000079e980000)
  from space 243200K, 61% used [0x00000007af800000,0x00000007b8a2e828,0x00000007be580000)
  to   space 260096K, 0% used [0x000000079e980000,0x000000079e980000,0x00000007ae780000)
 ParOldGen       total 1808896K, used 1344204K [0x00000005c0000000, 0x000000062e680000, 0x0000000715580000)
  object space 1808896K, 74% used [0x00000005c0000000,0x00000006120b33c8,0x000000062e680000)
 Metaspace       used 158697K, capacity 168228K, committed 168336K, reserved 1196032K
  class space    used 19121K, capacity 21115K, committed 21136K, reserved 1048576K
2021-10-03T06:22:03.116-0700: 2069.480: [GC (Allocation Failure) [PSYoungGen: 2398394K->133281K(2508800K)] 3742598K->1477494K(4317696K), 0.4692016 secs] [Times: user=1.77 sys=0.03, real=0.47 secs]
Heap after GC invocations=36 (full 5):
 PSYoungGen      total 2508800K, used 133281K [0x0000000715580000, 0x00000007bfd80000, 0x00000007c0000000)
  eden space 2248704K, 0% used [0x0000000715580000,0x0000000715580000,0x000000079e980000)
  from space 260096K, 51% used [0x000000079e980000,0x00000007a6ba8730,0x00000007ae780000)
  to   space 250368K, 0% used [0x00000007b0900000,0x00000007b0900000,0x00000007bfd80000)
 ParOldGen       total 1808896K, used 1344212K [0x00000005c0000000, 0x000000062e680000, 0x0000000715580000)
  object space 1808896K, 74% used [0x00000005c0000000,0x00000006120b53c8,0x000000062e680000)
 Metaspace       used 158697K, capacity 168228K, committed 168336K, reserved 1196032K
  class space    used 19121K, capacity 21115K, committed 21136K, reserved 1048576K
}
Pulse/Grafana Connector Log
This is the log of MMS thread responsible for integration of Pulse/Grafana and MMS.
| Appender | GRAFANA-FILE |
| Config | MetaMinerServer.logback.xml |
| Default Output | file |
| Default Filename | grafana.log |
| Default Level | DEBUG for MetaMiner modules, WARN for others |
| Default Rotation/Retention | max 2MB, max 3 days |
| Default Encoder (format) | %date{dd.MM;HH:mm:ss.SSS} [%thread] %-5level %logger{35} - %msg%n |
Example:
03.10;00:54:32.210 [StreamGobbler-grafana-OUTPUT-Thread] DEBUG c.i.server.utils.StreamGobbler - grafana-OUTPUT > t=2021-10-03T00:54:32-0700 lvl=info msg="Alert Rule returned no data" logger=alerting.evalContext ruleId=2 name="Memory(all hosts) alert" changing state to=no_data
03.10;00:55:03.226 [StreamGobbler-grafana-OUTPUT-Thread] DEBUG c.i.server.utils.StreamGobbler - grafana-OUTPUT > t=2021-10-03T00:55:03-0700 lvl=info msg="Alert Rule returned no data" logger=alerting.evalContext ruleId=1 name="CPU Alert alert" changing state to=no_data
03.10;00:55:32.216 [StreamGobbler-grafana-OUTPUT-Thread] DEBUG c.i.server.utils.StreamGobbler - grafana-OUTPUT > t=2021-10-03T00:55:32-0700 lvl=info msg="Alert Rule returned no data" logger=alerting.evalContext ruleId=2 name="Memory(all hosts) alert" changing state to=no_data
Pulse/Grafana Server Log
This is the log of Pulse/Grafana server.
| Appender | log.file |
| Config | /server/grafana/conf/defaults.ini |
| Default Output | file |
| Default Filename | server/grafana/data/logs/grafana.log |
| Default Level | INFO |
| Default Rotation/Retention | max 1M lines, max 28MB, max 7 days |
| Default Encoder (format) | t=%date{yyyy-dd-MM;HH:mm:ss.SSS} lvl=%level msg="%msg" logger=%logger ruleId=%rule name="%name" |
Example:
t=2021-09-27T02:36:02-0700 lvl=info msg="Alert Rule returned no data" logger=alerting.evalContext ruleId=1 name="CPU Alert alert" changing state to=no_data
t=2021-09-27T02:42:55-0700 lvl=info msg="Starting Grafana" logger=server version=5.3.2 commit=0d821d0 compiled=2018-10-24T05:06:27-0700
t=2021-09-27T02:42:55-0700 lvl=info msg="Config loaded from" logger=settings file="C:\\Program Files\\Infolytik\\MetaMiner\\server\\grafana/conf/defaults.ini"
t=2021-09-27T02:42:55-0700 lvl=info msg="Config overridden from Environment variable" logger=settings var="GF_SERVER_HTTP_PORT=3000"
t=2021-09-27T02:42:55-0700 lvl=info msg="Path Provisioning" logger=settings path="C:\\Program Files\\Infolytik\\MetaMiner\\server\\grafana\\conf\\provisioning"
t=2021-09-27T02:42:55-0700 lvl=info msg="App mode production" logger=settings
t=2021-09-27T02:42:55-0700 lvl=info msg="Connecting to DB" logger=sqlstore dbtype=sqlite3
Influx DB Connector Log
This is the log of MMS tread responsible for integration of Influx DB and MMS. By default, logging at the Influx DB server side is disabled.
| Appender | INFLUX-FILE |
| Config | MetaMinerServer.logback.xml |
| Default Output | file |
| Default Filename | influx.log |
| Default Level | DEBUG for MetaMiner modules, WARN for others |
| Default Rotation/Retention | max 2MB, max 3 days |
| Default Encoder (format) | %date{dd.MM;HH:mm:ss.SSS} [%thread] %-5level %logger{35} - %msg%n |
Example:
03.10;05:50:06.062 [StreamGobbler-influx-OUTPUT-Thread] DEBUG c.i.server.utils.StreamGobbler - influx-OUTPUT >
03.10;05:50:06.233 [StreamGobbler-influx-ERROR-Thread] DEBUG c.i.server.utils.StreamGobbler - influx-ERROR > [I] 2021-10-03T12:50:06Z Using data dir: data service=store
03.10;05:50:06.242 [StreamGobbler-influx-ERROR-Thread] DEBUG c.i.server.utils.StreamGobbler - influx-ERROR > [I] 2021-10-03T12:50:06Z data\_internal\monitor\79\000000002-000000002.tsm (#0) opened in 3.9997ms engine=tsm1 service=filestore
03.10;05:50:06.247 [StreamGobbler-influx-ERROR-Thread] DEBUG c.i.server.utils.StreamGobbler - influx-ERROR > [I] 2021-10-03T12:50:06Z reading file wal\_internal\monitor\79\_00009.wal, size 10488647 engine=tsm1 service=cacheloader
Long Query Log
This is a database connection slow log. When some database query is longer than a threshold, it is logged here. Normally, it is empty.
| Appender | LONG_QUERIES_FILE |
| Config | MetaMinerServer.logback.xml |
| Default Output | file |
| Default Filename | longquery.log |
| Default Level | DEBUG |
| Default Rotation/Retention | max 5MB, max 10 volumes |
| Default Encoder (format) | %date{dd.MM;HH:mm:ss.SSS} [%thread] %-5level %logger{35} - %msg%n |
MMDB Log
MMDB log. Not used?
| Appender | MMDB-FILE |
| Config | MetaMinerServer.logback.xml |
| Default Output | file |
| Default Filename | mmdb.log |
| Default Level | DEBUG for MetaMiner modules, WARN for others |
| Default Rotation/Retention | max 5MB, max 10 days |
| Default Encoder (format) | %date{dd.MM;HH:mm:ss.SSS} [%thread] %-5level %logger{35} - %msg%n |
PostgreSQL Connector Log
This is the log of MMS thread responsible for communication with PostgreSQL Database server. PostgreSQL server logs are available on the host where this server is installed.
| Appender | POSTGRES-FILE |
| Config | MetaMinerServer.logback.xml |
| Default Output | file |
| Default Filename | postgres.log |
| Default Level | DEBUG for MetaMiner modules, WARN for others |
| Default Rotation/Retention | max 2MB, max 3 days |
| Default Encoder (format) | %date{dd.MM;HH:mm:ss.SSS} [%thread] %-5level %logger{35} - %msg%n |
Example:
03.10;05:46:32.277 [StreamGobbler-pg-stop-OUTPUT-Thread] DEBUG c.i.server.utils.StreamGobbler - pg-stop-OUTPUT Gobbler Started
03.10;05:46:32.277 [StreamGobbler-pg-stop-ERROR-Thread] DEBUG c.i.server.utils.StreamGobbler - pg-stop-ERROR Gobbler Started
03.10;05:46:33.755 [StreamGobbler-pg-stop-OUTPUT-Thread] DEBUG c.i.server.utils.StreamGobbler - pg-stop-OUTPUT > waiting for server to shutdown..... done
MetaMiner Server Log
Server and SLC are the main MMTE Server logs. They both are vastly important for MetaMiner diagnostics, you can track all critical activities on MMS by reading it.
While SLC log is brief, Server log contains every detail about all actions. Normally, you look through SLC log and see an unsuccessful pull operation. Then you switch to Server log to determine which object ruined this operation.
| Appender | FILE |
| Config | MetaMinerServer.logback.xml |
| Default Output | file |
| Default Filename | server.log |
| Default Level | DEBUG for MetaMiner modules, WARN for others |
| Default Rotation/Retention | max 10MB, max 14 days |
| Default Encoder (format) | %date{dd.MM;HH:mm:ss.SSS} [%thread] %-5level %logger{35} - %msg%n |
Example:
03.10;05:52:14.662 [TAB Pull Deep Processing Thread-BI4005.CORP.INFOLYTIK.IK] ERROR com.infolytik.server.tab.Zb5 - Local Type is null for DataSource "BI4005:1589386464027:81:federated.0zduaiz0769vvr18qcccy19i1w5k" MetaDataRecord: [wikipedia]
03.10;05:52:22.114 [TAB Pull Deep Processing Thread-TB003.CORP.INFOLYTIK.IK] INFO  com.infolytik.server.tab.Zfw - Final processing stat: TB003.CORP.INFOLYTIK.IK processWorksheetsXml took 8 seconds
03.10;05:52:22.152 [TAB Pull Deep Processing Thread-TB003.CORP.INFOLYTIK.IK] INFO  com.infolytik.server.tab.Zfw - Final processing (without IA dictionary) for pull #1 for Tableau environment TB003(2019.1.2)/HOST123.CORP.COMPANY.COM (1543933977893) took 48 seconds
03.10;05:52:22.167 [TAB Pull Deep Processing Thread-TB003.CORP.INFOLYTIK.IK] DEBUG com.infolytik.server.tab.Zft - Persistence IA metadata for pull #1 tab environment HOST123.CORP.COMPANY.COM/TB003(2019.1.2) (1543933977893) started at 2021-10-03T12:52:22.167
03.10;05:52:22.844 [TAB Pull Deep Processing Thread-TB003.CORP.INFOLYTIK.IK] ERROR com.infolytik.server.tab.Zft - TB003(2019.1.2) connections [[293, 326, 360, 359, 118, 349, 306, 344, 110, 237, 357, 130, 290, 347, 297, 320, 327, 133, 106, 236, 292, 310, 322]] .getDatasourceId() is null
MMS Loader Log
This is the log of the Windows OS executable which runs MMS system service. The loader sends logging information to stdout and stderr streams. This information is then written to a log file.
| Appender | STDOUT, STDERR |
| Config | MetaMinerServer.ini and MetaMinerServer.logback.xml |
| Ini config variable | log |
| Default Output | console, redirected to a file |
| Default Filename | server.start.log |
| Default Level | DEBUG |
| Default Encoder (format) | %-4relative [%thread] %-5level %logger{35} - %msg %n |
Example:
[info] Module Name: C:\Program Files\Infolytik\MetaMiner\server\MetaMinerServer.exe
[info] Module INI: C:\Program Files\Infolytik\MetaMiner\server\MetaMinerServer.ini
[info] Module Dir: C:\Program Files\Infolytik\MetaMiner\server\
[info] INI Dir: C:\Program Files\Infolytik\MetaMiner\server\
[info] Working directory set to: C:\Program Files\Infolytik\MetaMiner\server
[info] Configured vm.location: ..\jre\bin\server\jvm.dll
[info] Found VM: C:\Program Files\Infolytik\MetaMiner\jre\bin\server\jvm.dll
[info] Expanding Classpath: lib\*.jar
08:12:19,163 |-INFO in ch.qos.logback.classic.LoggerContext[default] - Found resource [MetaMinerServer.logback.xml] at [file:/C:/Program%20Files/Infolytik/MetaMiner/server/MetaMinerServer.logback.xml]
08:12:19,423 |-INFO in ch.qos.logback.classic.joran.action.ConfigurationAction - debug attribute not set
08:12:19,426 |-INFO in ch.qos.logback.core.joran.action.AppenderAction - About to instantiate appender of type [ch.qos.logback.core.rolling.RollingFileAppender]
08:12:19,461 |-INFO in ch.qos.logback.core.joran.action.AppenderAction - Naming appender as [FILE]
08:12:19,660 |-INFO in c.q.l.core.rolling.TimeBasedRollingPolicy@707610042 - Will use zip compression
08:12:19,664 |-INFO in c.q.l.core.rolling.TimeBasedRollingPolicy@707610042 - Will use the pattern logs/server-%d{yyyy-MM-dd}-%i.log for the active file
08:12:19,672 |-INFO in ch.qos.logback.core.rolling.SizeAndTimeBasedFNATP@2a5ca609 - The date pattern is 'yyyy-MM-dd' from file name pattern 'logs/server-%d{yyyy-MM-dd}-%i.log.zip'.
Note
Encoder (format) settings cannot be applied to log event messages from the loader itself. They are always in the [%level] %msg format. See several first lines in the example above.
SLC Log
Server and SLC (Server LifeCycle) are the main MMTE Server logs. They both are vastly important for MetaMiner diagnostics, you can track all critical activities on MMS by reading it.
While SLC log is brief, Server log contains every detail about all actions. Normally, you look through SLC log and see an unsuccessful pull operation. Then you switch to Server log to determine which object ruined this operation.
| Appender | SLC-FILE |
| Config | MetaMinerServer.logback.xml |
| Default Output | file |
| Default Filename | slc.log |
| Default Level | DEBUG for MetaMiner modules, WARN for others |
| Default Rotation/Retention | max 10MB, max 14 days |
| Default Encoder (format) | %date{dd.MM;HH:mm:ss.SSS} [%thread] %-5level %logger{35} - %msg%n |
Example:
04.10;00:00:03.480 [TAB Etl Worker Thread-1627301360850] INFO  com.infolytik.server.tab.Zco - ETL process #99 for Tableau environment MSS077 (1627301360850) started
04.10;00:00:39.916 [TAB Etl Worker Thread-TB00X.CORP.COMPANY.COM] INFO  com.infolytik.server.tab.Zco - ETL process #99 for Tableau environment AMS088 (1614238350832) started
04.10;00:01:47.704 [TAB Pull Service Thread-MH004.CORP.COMPANY.COM] DEBUG com.infolytik.server.cms.Zbd - Snapshot #99 for TABLEAU ENV MH002.CORP.COMPANY.COM/MH1 1589386137009 received
04.10;00:01:47.888 [TAB Pull Service Thread-MH004.CORP.COMPANY.COM] INFO  com.infolytik.server.tab.Zfw - Pull #99 for Tableau environment MH002.CORP.COMPANY.COM (1589386137009) done
04.10;00:03:36.212 [TAB Pull Service Thread-1627301360850] INFO  com.infolytik.server.tab.Zfw - Pull #99 for Tableau environment PB002/1627301360850 (1627301360850) started
04.10;00:03:42.391 [TAB Pull Service Thread-1627301360850] DEBUG com.infolytik.server.cms.Zbd - Snapshot #99 for TABLEAU ENV 1627301360850/PB002 1627301360850 received
04.10;00:03:42.528 [TAB Pull Service Thread-1627301360850] INFO  com.infolytik.server.tab.Zfw - Pull #99 for Tableau environment PB002/1627301360850 (1627301360850) done
Tableau Metadata Errors Log
This log contains errors found while deep pull processing of your BI data.
| Appender | TABLEAU-METADATA-ERRORS-FILE |
| Config | MetaMinerServer.logback.xml |
| Default Output | file |
| Default Filename | tableau-metadata-errors.log |
| Default Level | DEBUG for MetaMiner modules, WARN for others |
| Default Rotation/Retention | max 10MB, max 30 days |
| Default Encoder (format) | %date{dd.MM;HH:mm:ss.SSS} [%thread] %-5level %logger{35} - %msg%n |
Example:
04.10;00:09:56.823 [TAB Pull Deep Processing Thread-BI4005.CORP.COMPANY.COM] ERROR com.infolytik.server.tab.Zcp - dataSourceXmlField.getTableId() is null. XmlField: BI4005:2778:[Number of Records]
04.10;00:09:56.823 [TAB Pull Deep Processing Thread-BI4005.CORP.COMPANY.COM] ERROR com.infolytik.server.tab.Zcp - dataSourceXmlField.getTableId() is null. XmlField: BI4005:2778:[Category (copy)]
04.10;00:09:56.823 [TAB Pull Deep Processing Thread-BI4005.CORP.COMPANY.COM] ERROR com.infolytik.server.tab.Zcp - dataSourceXmlField.getTableId() is null. XmlField: BI4005:2779:[Calculation_1737545042430935042]
04.10;00:09:56.823 [TAB Pull Deep Processing Thread-BI4005.CORP.COMPANY.COM] ERROR com.infolytik.server.tab.Zcp - dataSourceXmlField.getTableId() is null. XmlField: BI4005:2779:[Term Reason Code Merge (group)]
04.10;00:09:56.824 [TAB Pull Deep Processing Thread-BI4005.CORP.COMPANY.COM] ERROR com.infolytik.server.tab.Zcp - dataSourceXmlField.getTableId() is null. XmlField: BI4005:2779:[Calculation_1737545042431373318]
04.10;00:10:45.407 [TAB Pull Deep Processing Thread-BI4005.CORP.COMPANY.COM] WARN  c.i.data.tab.DataConnectionClass - DataConnection type for impala not found
Thread Dump Log
This is the log where MMS periodically dumps the information about currently running server threads. It helps understand which task causes system to crash, freeze, or slow down. The thread dump shows what MMS is doing at that very moment.
When some thread performs its task for too long (exceeding the corresponding timeout, individual for certain task types), then all threads dump is written to this log as a kind of snapshot of what the whole system was doing in a critical situation.
| Appender | THREAD_DUMP-FILE |
| Config | MetaMinerServer.logback.xml |
| Default Output | file |
| Default Filename | threads.log |
| Default Level | WARN |
| Default Rotation/Retention | max 5MB, max 10 volumes |
| Default Encoder (format) | %date{dd.MM;HH:mm:ss.SSS} [%thread] %-5level %logger{35} - %msg%n |
Example:
28.09;14:39:46.922 [ThreadDumpScheduler Thread-0] WARN  threads - Full thread dump because of action timeout (3600 sec.):
Waiting deep processing task queue for 1627301360850
at: com.infolytik.server.tab.Zfz.run(Zfz.java:2170)
MetaMiner Client  5.2.5593
Java HotSpot(TM) 64-Bit Server VM (25.91-b15 mixed mode)
Local time: Tue, 28 Sep 2021 21:39:45.74 GMT [GMT]

"main" Id=1 RUNNABLE (in native) waitedTime -1
Stack trace:

"Reference Handler" Id=2 WAITING on java.lang.ref.Reference$Lock@64291a43 waitedTime -1
Stack trace:
        at java.lang.Object.wait(Native Method)
        at java.lang.Object.wait(Unknown Source)
        at java.lang.ref.Reference.tryHandlePending(Unknown Source)
        at java.lang.ref.Reference$ReferenceHandler.run(Unknown Source)

"Finalizer" Id=3 WAITING on java.lang.ref.ReferenceQueue$Lock@674d7b5e waitedTime -1
Stack trace:
        at java.lang.Object.wait(Native Method)
        at java.lang.ref.ReferenceQueue.remove(Unknown Source)
        at java.lang.ref.ReferenceQueue.remove(Unknown Source)
        at java.lang.ref.Finalizer$FinalizerThread.run(Unknown Source)
Danger
Although generating a thread dump is an important tool for diagnostics, you should never attempt to fix or troubleshoot your MMTE system on your own if the scope of the issue requires a thread dump analysis. Instead, provide the thread dump to Infolytik Support for further guidance.
The thread dump is also available online, via HTTP. To open it:
- Launch a web browser on any host.
-
In the address bar, enter:
http://<MMS host name>:<MetaMiner port>/td, for example:http://pg001.corp.infolytik.ik:49714/tdMetaMiner Port Number
The ":49714" in the example above was taken from the MMA Settings:
MetaMiner Administrator > Preferences > Settings > General: Server port: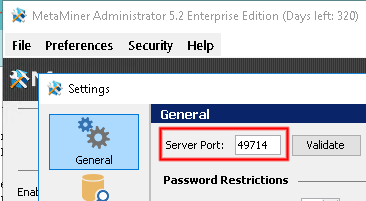
The page with the current thread dump opens.
-
Press
Ctrl-Swhich then prompts a Save As dialog box and save the file asmetaminer-thread-dump_<date>.txt. - Email this file to Infolytik Support with a description of the problem.
Tip
The following video demonstrates how to open thread dump online:
See Also