Similarity – Overview
The ![]() Similarity additional application tab helps you find published data sources which provide fully or partially similar data than found in one or more selected Tableau workbooks.
Similarity additional application tab helps you find published data sources which provide fully or partially similar data than found in one or more selected Tableau workbooks.
This tab can be opened from Tableau Explorer. Its interface is close to the one of Tableau IA.
Why would I use it?
Use the Similarity tab for
-
Comparing versions of your workbooks and data sources
-
Finding "lost" data sources in large BI landscapes
Similarity Tab UI
The Similarity tab UI consists of three areas:
 Toolbar with available commands


Toolbar
The toolbar of the Similarity tab is located on top of the Content Area and includes the following elements:
| Command | Description |
|---|---|
| Search | Quick Search tool. BI assets that match will be have a purple outline around them. |
| Auto select | Set this checkbox to have BI assets that match the search criteria being automatically selected. |
| Zoom In/Out | This element shows the current zoom level and allows to change it. |
Click to open the Export Shown Items to CSV file dialog box where you can choose the filename and location, by default tableau_impact_export.csv |
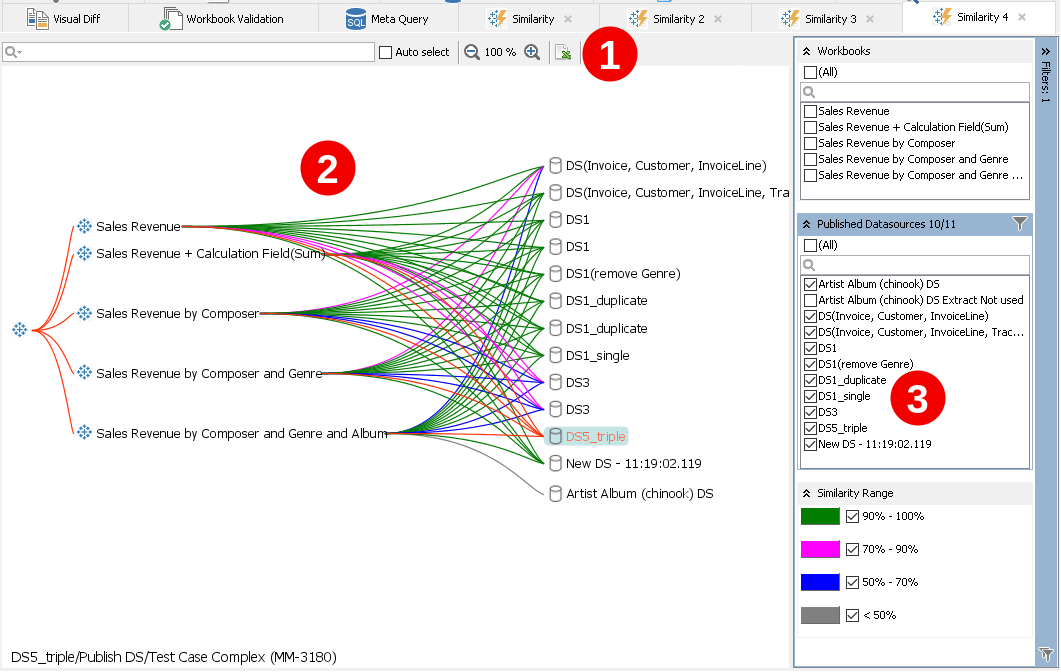
Content Area
The Content Area of the Similarity tab displays a graph with three layers of vertices:
- Top: an abstract workbook node.
- Workbooks (previously selected in Tableau Explorer).
- Published Data Sources (found by the Similarity tab).
Edges are relations between them. Colors of them are meaningful:
| Color | Description |
|---|---|
Dark Green |
Similarity in range 90..100% is detected. |
Purple |
Similarity in range 70..90% is detected. |
Dark Blue |
Similarity in range 50..70% is detected. |
Gray |
Similarity is low, < 50%. |
Red |
On edge selection or on hover mouse action. |
To manipulate the displayed graph, click its vertices to open the Context Menu and choose any of the available commands.
On mouse hover action over workbooks, Similarity shows exact percentage of detected similarity:
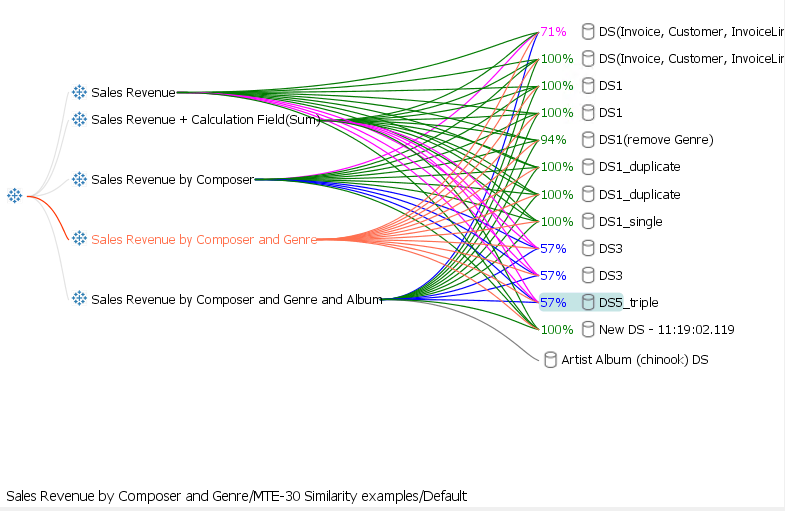
Here you hold the mouse cursor over the Sales Revenue by Composer and Genre workbook. It is shown in red, as well as its relations. At the bottom of the Content Area the name of this workbook and its containers is displayed: Sales Revenue by Composer and Genre/MTE-30 Similarity examples/Default, where MTE-30 Similarity examples is its project name and Default is its site name.
You see that the content provided by the DS1 data source is 100% similar to the selected workbook, and the content of DS3 is 57% similar, etc.
You can move the visible area by clicking it with the left mouse button and holding it, then moving the area to the desired direction.
Context Menu
The Similarity tab offers a number of commands in the context menu.
The context menu is accessed by right-clicking on one or more selected vertices in the Content Area.
It contains the following items:
- Open in Default Browser
- Open in New Tab
- Properties
- Hide
- Hide Others
- Hide Unrelated
- Select All
- Zoom to Fit
Filter Pane
Filter Pane in the Similarity tab contains the following filter groups:
Filters help hiding business objects that are not important to see.
How It Works
How to launch and use the Similarity tab:
-
Open Tableau Explorer.
-
Select one or more workbooks in the Content Area, in the same or different sites, in the same environment.
-
Right click them and choose Similarity Analysis... from the context menu.
If at least minimum similarities are found, the Similarity additional tab opens.
-
Hide the unnecessary BI assets from the view by using Filter Pane, the Hide, Hide Unrelated, and Hide Others commands.
- Explore the remaining business objects, displayed in the Content Area, and find the answers to your original questions.