Pulse Alerting
Set threshold alerts on Pulse dashboard panels so you are notified when a BusinessObjects metric crosses a limit.
Use MetaMiner Alerts for most notifications
MetaMiner Alerts, created in the MetaMiner Client (MMC), cover server availability, SQL-based conditions on MetaMiner metadata, the audit database, report refresh tests and more, with email notification and history. Use Pulse alerting only for thresholds on a Grafana panel that MetaMiner Alerts cannot express.
Choose an alerting method
| Need | Use |
|---|---|
| A BusinessObjects server stops responding | MetaMiner Alerts, Server Availability |
| A condition you can write as SQL on MetaMiner metadata (failed schedules, new admins, stale content) | MetaMiner Alerts, SQL Script |
| A condition in the BusinessObjects audit database | MetaMiner Alerts, SQL Script (Audit DB) |
| A report must refresh successfully | MetaMiner Alerts, Report Refresh |
| A host or process metric over a threshold for a period (CPU, memory) | Pulse alerting (this page) |
How Pulse alerting works
Pulse is built on Grafana. An alert rule evaluates a query on a schedule and notifies a contact point (email, chat and so on) when its state changes.
Alerts fire on state changes only
An alert evaluated every minute from 10:00:
TODO: document alert rules for the Grafana version that ships with current Pulse
Current MetaMiner releases run Grafana 12, where alerts are set up under Alerting > Contact points and Alerting > Alert rules, not in the panel editor. Re-document the steps below for that interface. Until then, follow Grafana Alerting.
Alert walkthrough for earlier Pulse releases
The steps below apply to Pulse releases whose Grafana version has an Alert tab in the panel editor. They use a CPU utilisation dashboard as the example.
Set up a notification channel
-
Click Alerting > Notification channels.

-
Click Add New channel and enter the details.
- Click Send Test to test the notification.
- Click Save.
Create the alert
The example dashboard has one graph panel. Its server names come from the template variables Environment and Server Name.
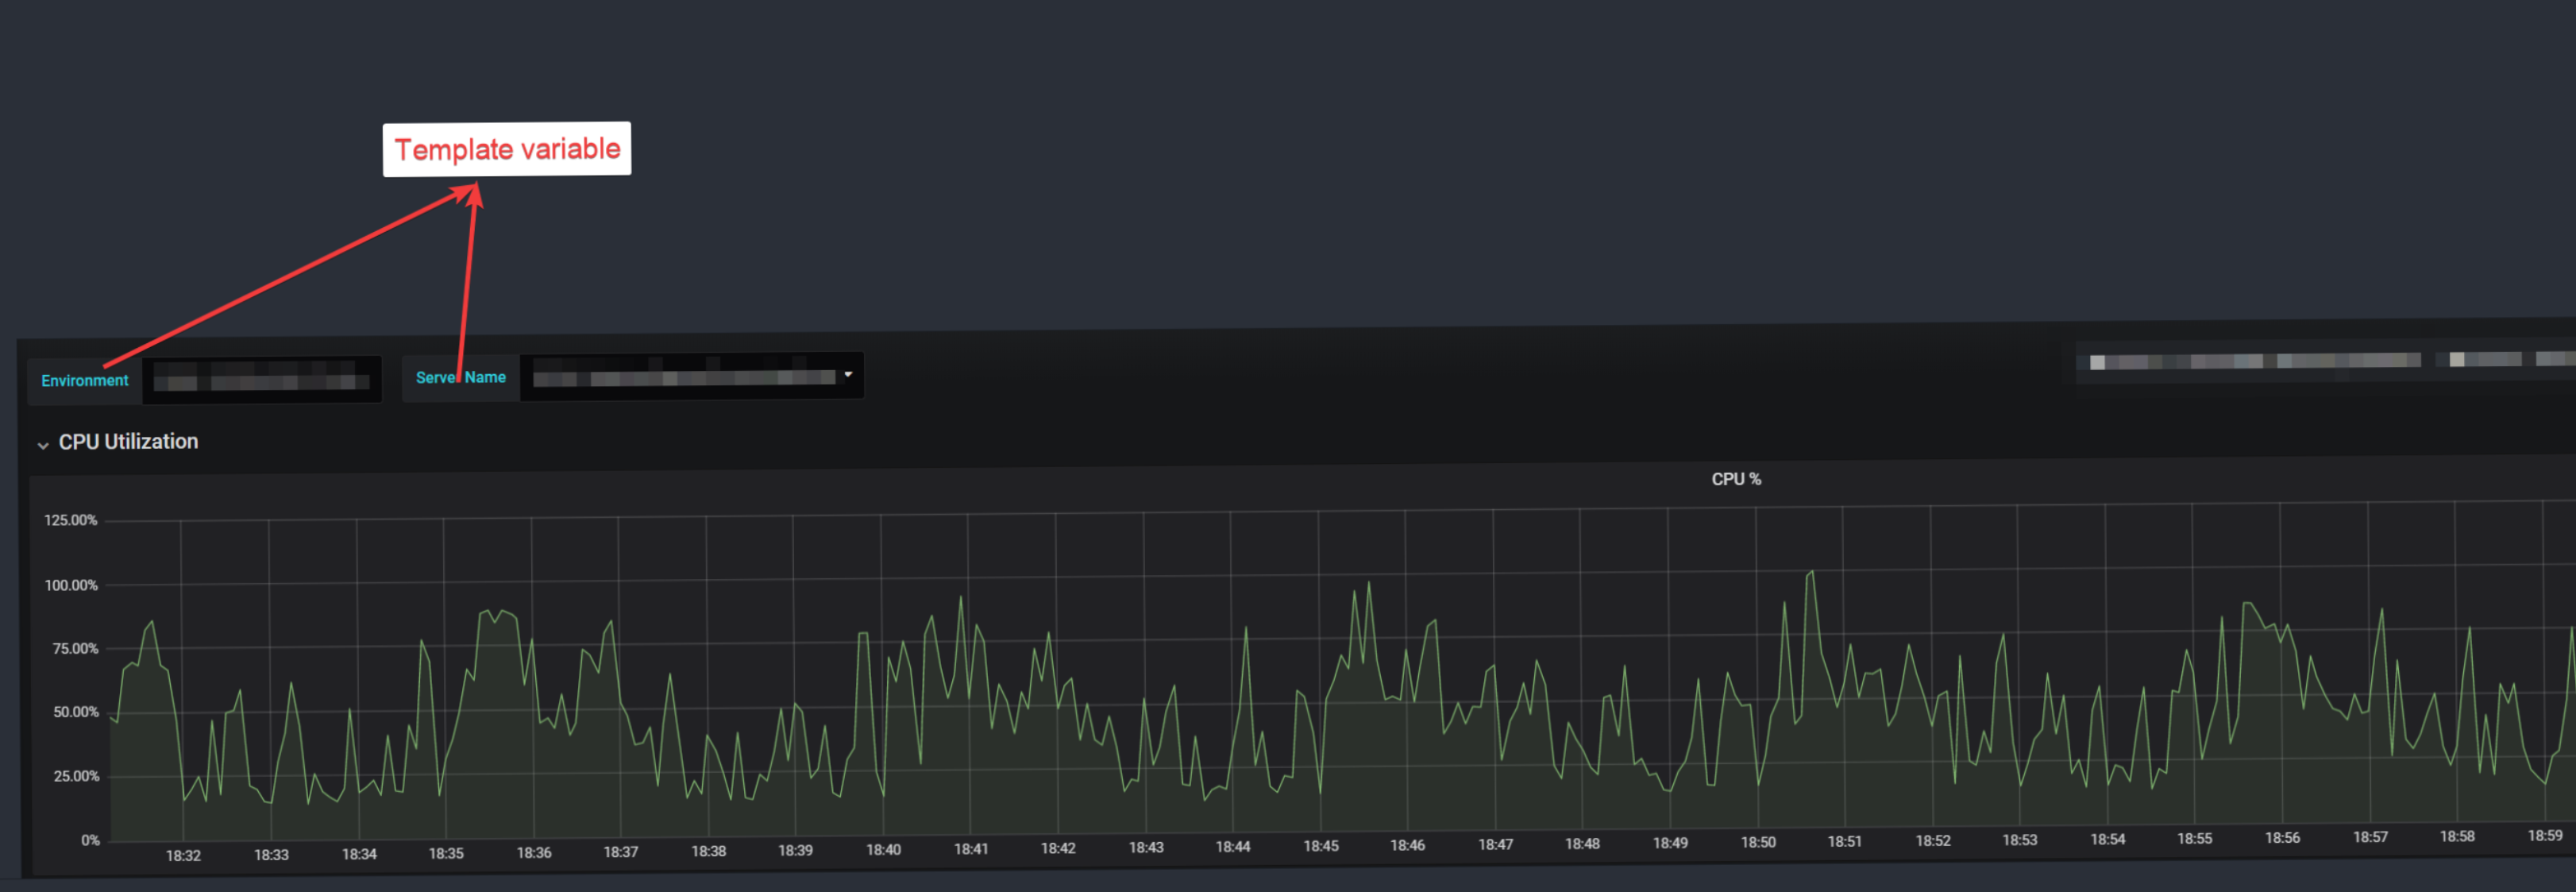
Template variables cannot be used in alerts
Dashboard template variables (here Environment and Server Name) filter the view only. Alert queries must name the server literally, so create one panel per server you want to alert on.
-
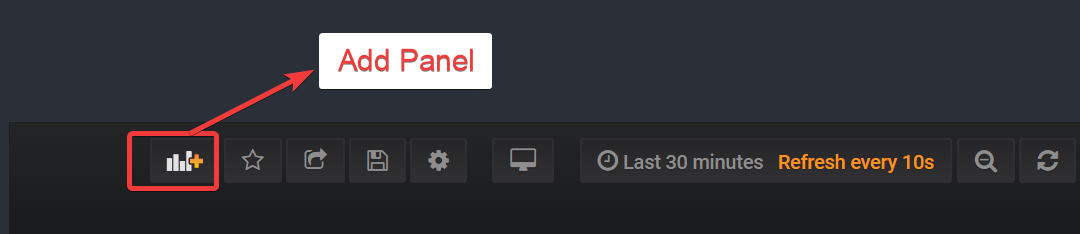
Click Add panel and select Graph.
-
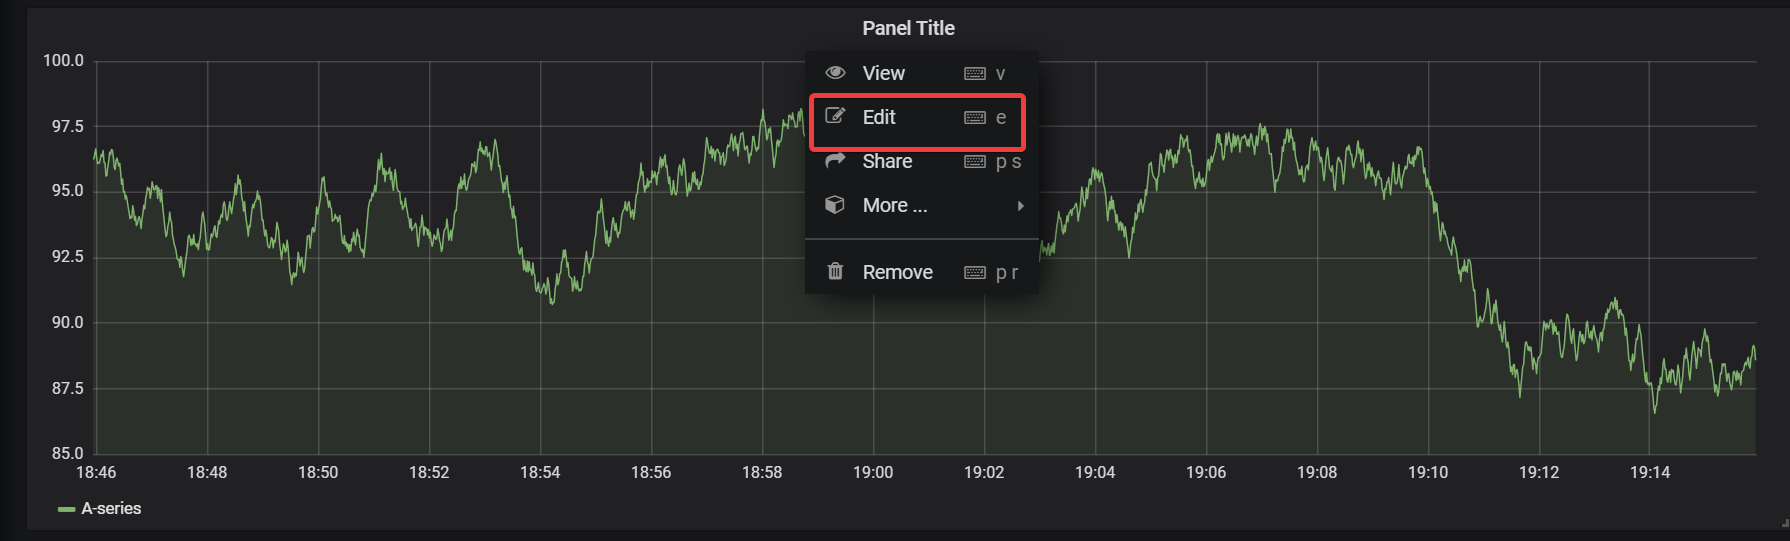
Open the Panel Title menu and click Edit.
-
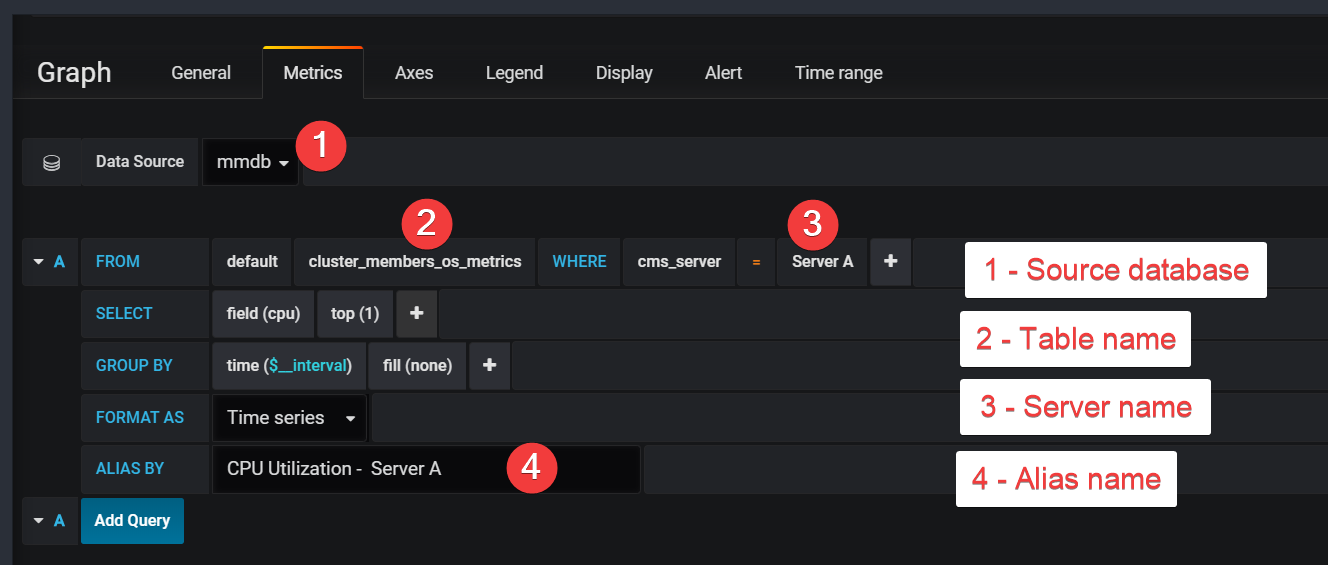
Change Query A to return the CPU percentage for one server, with the server name written in the query.
-
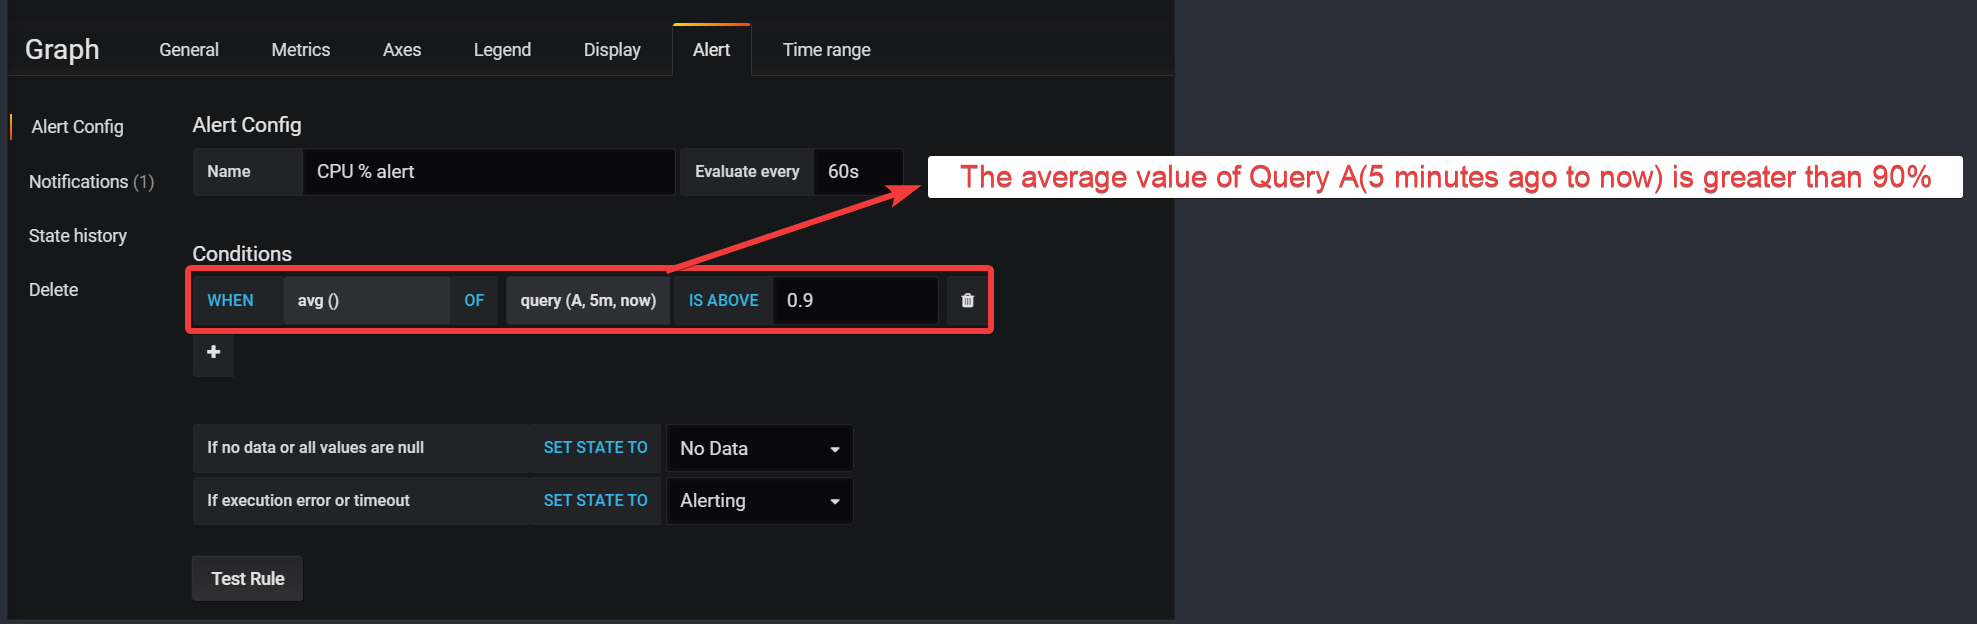
On the Alert tab, set the threshold.
-
Click Test Rule to evaluate the current state.
-
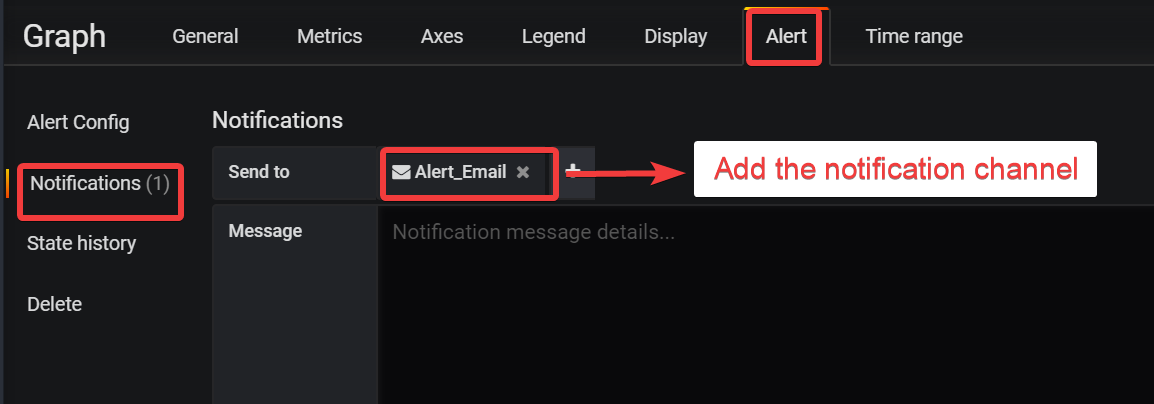
Under Notifications, add the notification channel.
-
Save the dashboard. State History shows the last 50 state changes of the alert.
Repeat for each server.