Pulse Overview
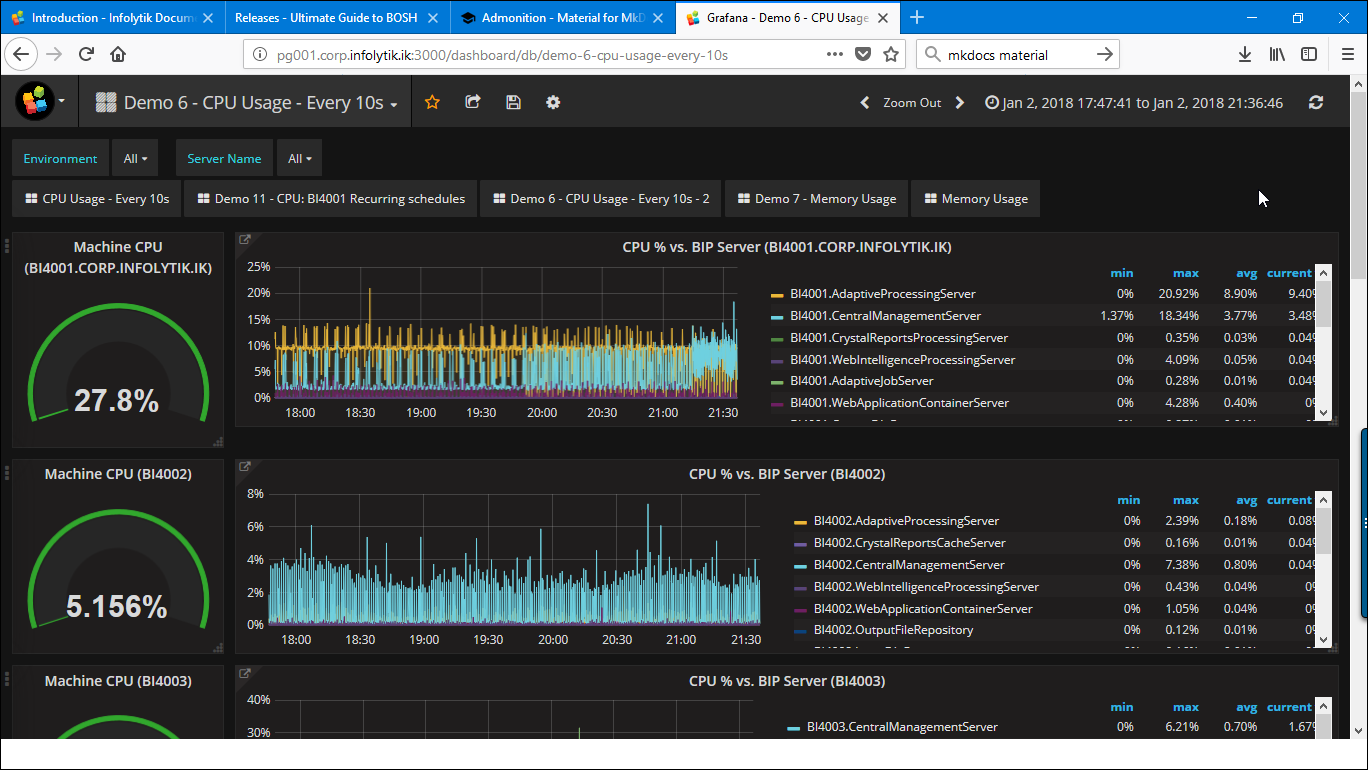
Pulse shows the health of your BusinessObjects landscape in real time: response times, CPU and memory use, sessions, scheduling and per-process behaviour.
Pulse also correlates system load with the users and content of your BI platform, to answer questions such as:
- Do users see slower response times at certain times of the week?
- Do schedules run during peak interactive use, and which ones?
Pulse now has two parts: Monitor and the Grafana dashboards
For BusinessObjects host and process metrics, use the Monitor web app. In the MetaMiner Client (MMC) File > Launch Pulse... opens Monitor, and in the MetaMiner Administrator (MMA) its switch is labelled Pulse (/web/monitor). See Monitor. For notifications on thresholds and conditions, use MetaMiner Alerts. This section documents the Grafana-based Pulse dashboards, which remain available for the landscape, session and scheduling dashboards listed in Server Monitoring Dashboards.
How it works
| Part | What it does |
|---|---|
| Remote metrics agent | A Windows service you install on each BusinessObjects node. It sends host and process metrics to the MetaMiner Server (MMS). Monitor and the Grafana dashboards both use its data. |
| MetaMiner Server | Stores the metrics in the MetaMiner Database (MMDB) and, when Pulse is enabled, runs Grafana as a child process. |
| Grafana dashboards | Served by MMS on port 3000 by default. MMS loads the dashboards that ship in <install folder>\server\data\dashboards automatically. |
| Monitor web app | Served through the MMS port at /web/monitor/. |
Enable Pulse
Pulse is installed with MetaMiner; there is no separate installer. Not every license includes it. If you cannot open Pulse, contact Infolytik support to review your license.
- In MMA, open Preferences > Settings > General.
- Select Pulse Enabled.
- In the password fields next to it, set the Pulse password. This is the password of the Grafana
adminuser. - Save and restart the MetaMiner service when prompted.
See General settings.
Install the remote metrics agent
To collect metrics at process level, install the MetaMiner Remote Metric Agent on every BusinessObjects node.
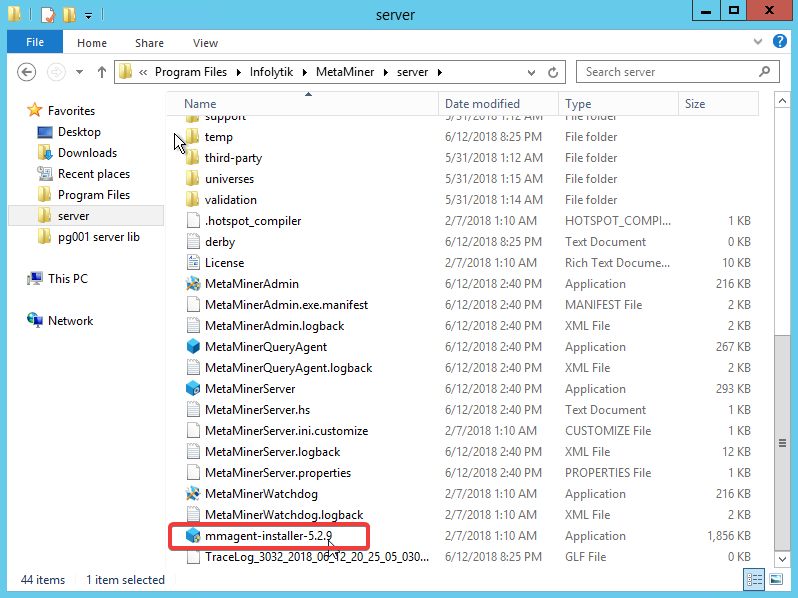
- On the MetaMiner Server, open
<install folder>\server. - Find the installer
mmagent-installer-<version>.exe. - Copy it to each BusinessObjects node that runs any BusinessObjects server component.
- Run it and complete the wizard. Install to the C: drive.
Install the agent on the C: drive
The agent must be installed on the C: drive.
Video walk-through of the agent installation:
The agent reports at the interval set in MMA (Preferences > Settings > Metrics, Poll period for remote metrics agent, in seconds). See Metrics settings.
Open the Grafana dashboards
- In a browser, go to
http://<metaminer-server>:3000. - Sign in as
adminwith the Pulse password set in MMA. - Open the dashboard list to pick a dashboard.
Open port 3000
Users connect to the Grafana dashboards on port 3000 (configurable with grafana.port). Open it in the firewall only for the people who need Pulse. See Network Ports and Firewall.
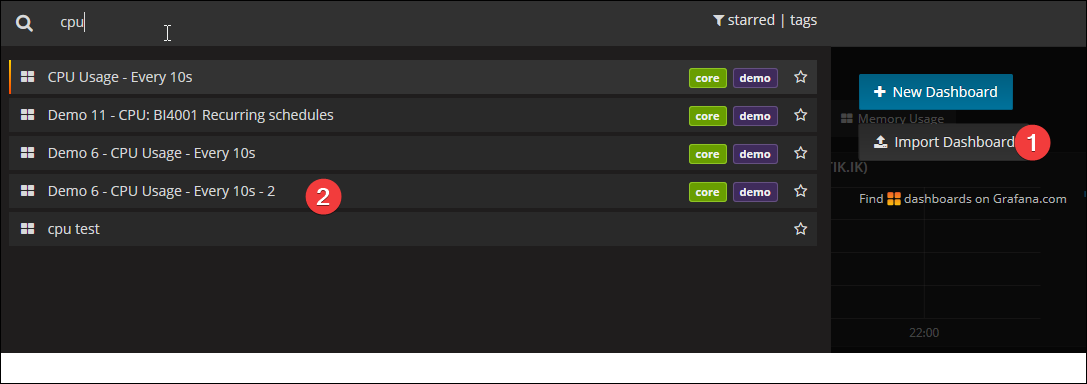
Import a dashboard from Infolytik support
Infolytik support may send you additional dashboards as JSON files. Import them in Grafana with Dashboards > New > Import, then open the dashboard to check it shows data.