Create Alerts in Pulse
In the following section we explain how BI Administrators can create alerts to monitor the health of their BusinessObjects or Tableau landscape proactively
Purpose
This Alerting feature in MetaMiner Pulse helps BI Administrators to set rules at certain thresholds in their dashboard and get alerted once those thresholds are met
This includes two parts :
1. Setting up notification channel
2. Setting up alerts
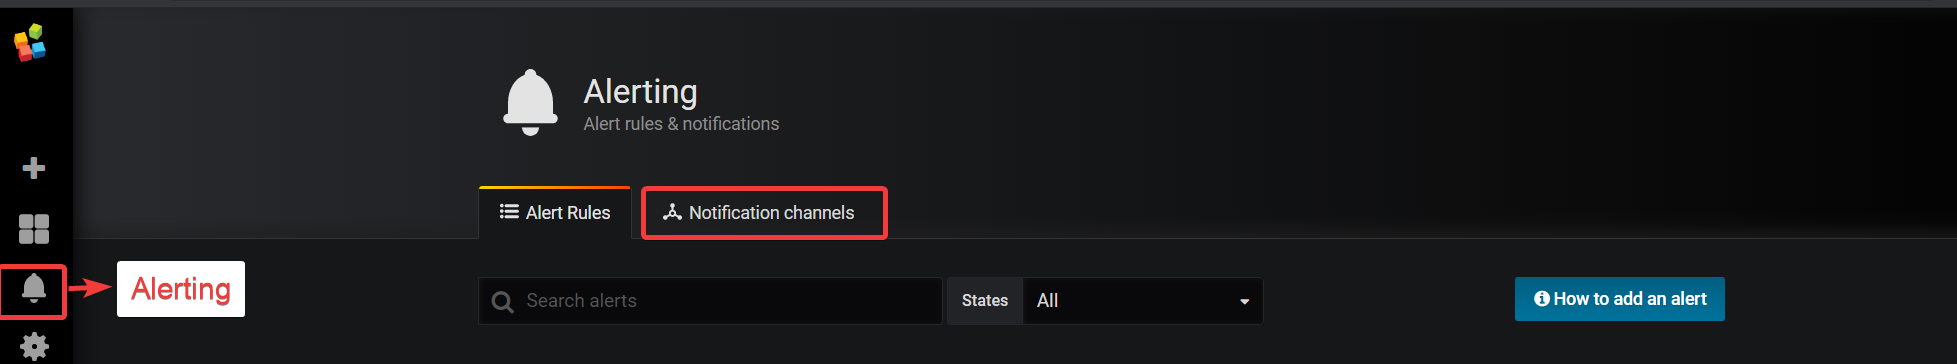
Setting up notification channel
1.Click on Alerting - > Notification channels
2.Click on “Add New channel” button and provide the required details
3.Click on “Send Test” to test the notification from Pulse
4.Click on “Save” to save the notification channel
Setting up the alerts
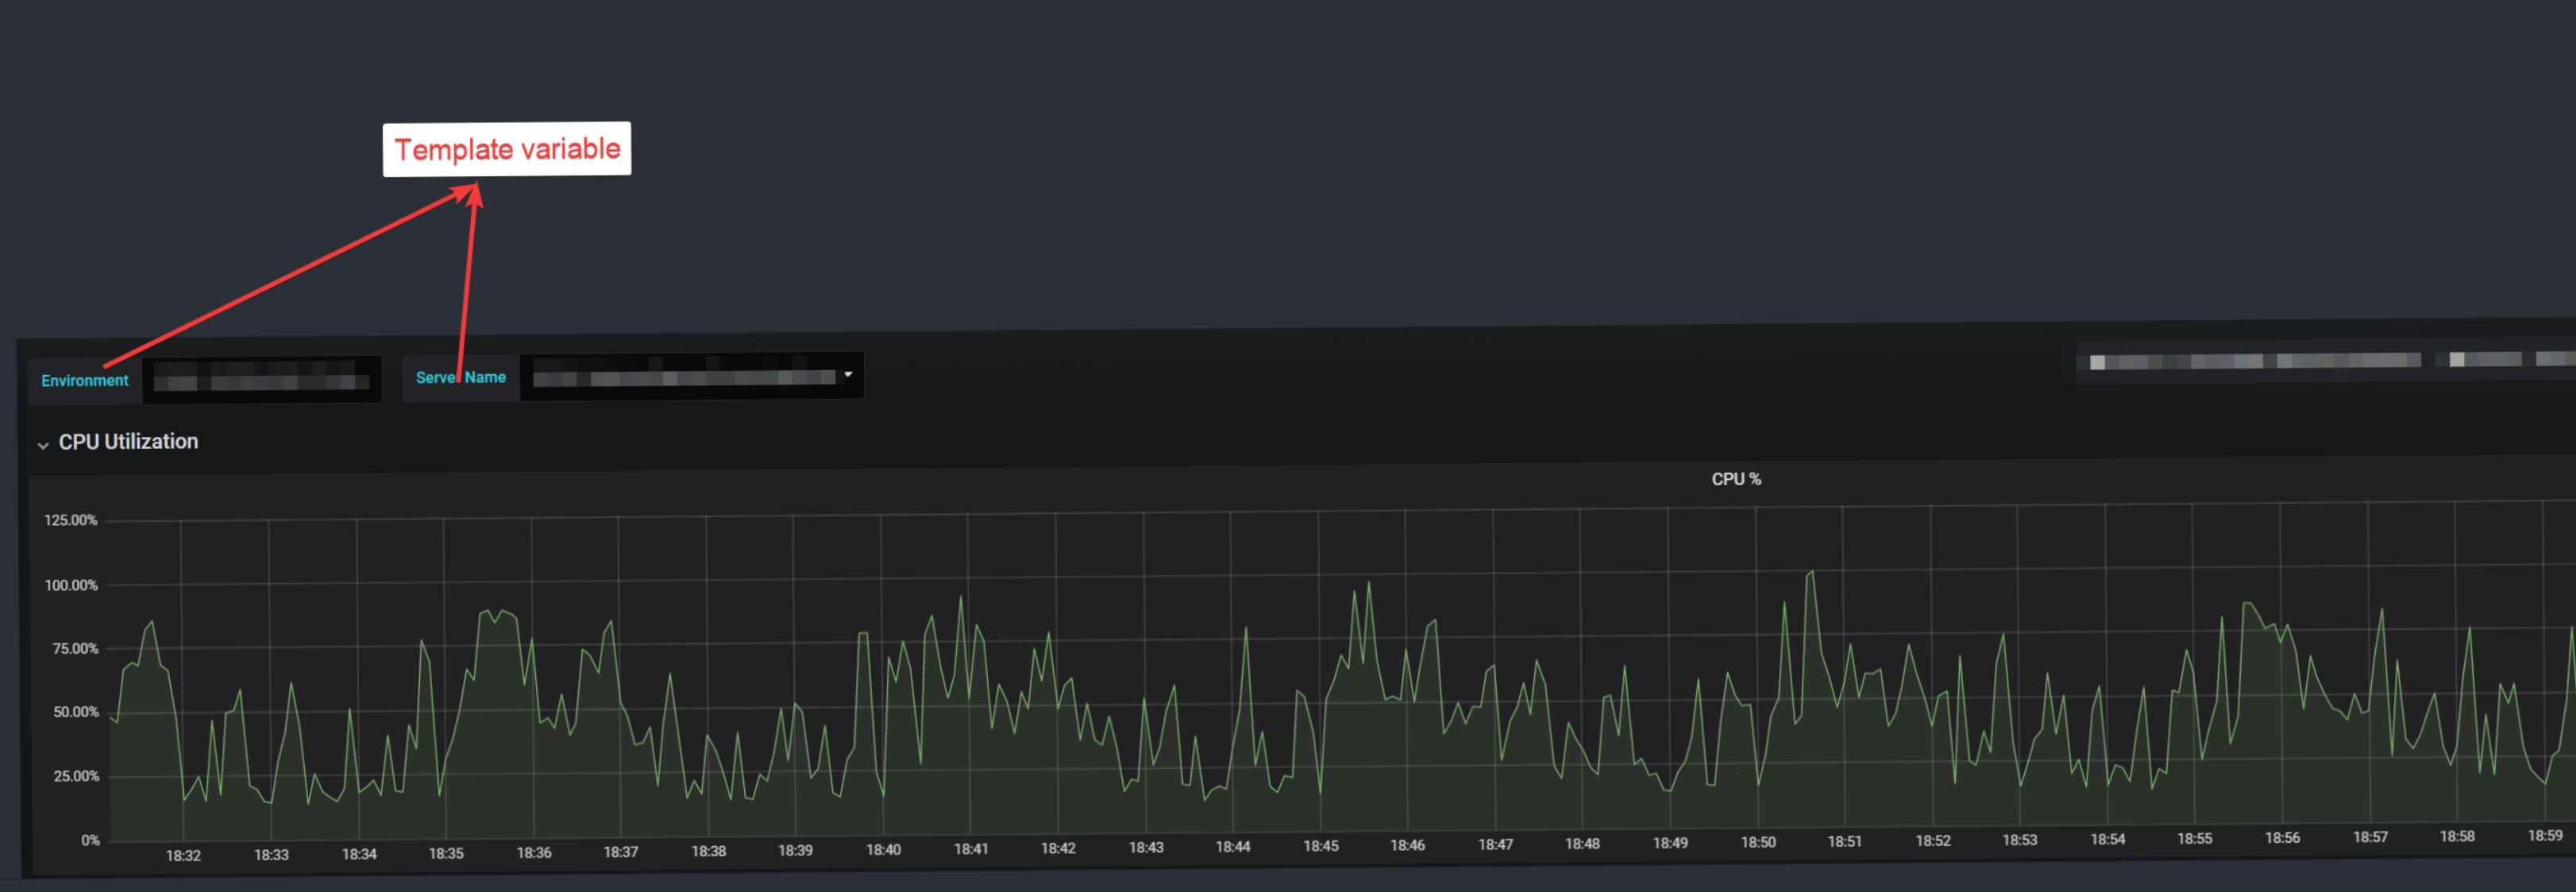
This part is explained with a simple “CPU Utilization” dashboard
Important
The above dashboard has a single panel graph where the server names are fed dynamically through template variables.(“Environment” and “Server Name”)
Template variables are noting but the variables created at dashboard level for applying adhoc user filters which cannot be used in Alerting.
Environment and Server Name are the template variables created in this dashboard and cannot be used in Alerting
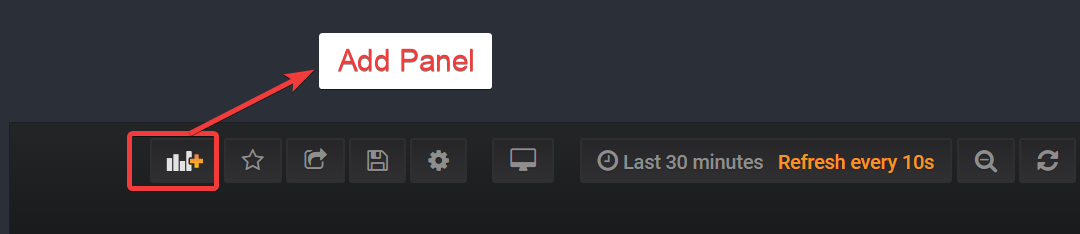
1.Click on “Add panel” and select “Graph” present in the top right side of the dashboard page
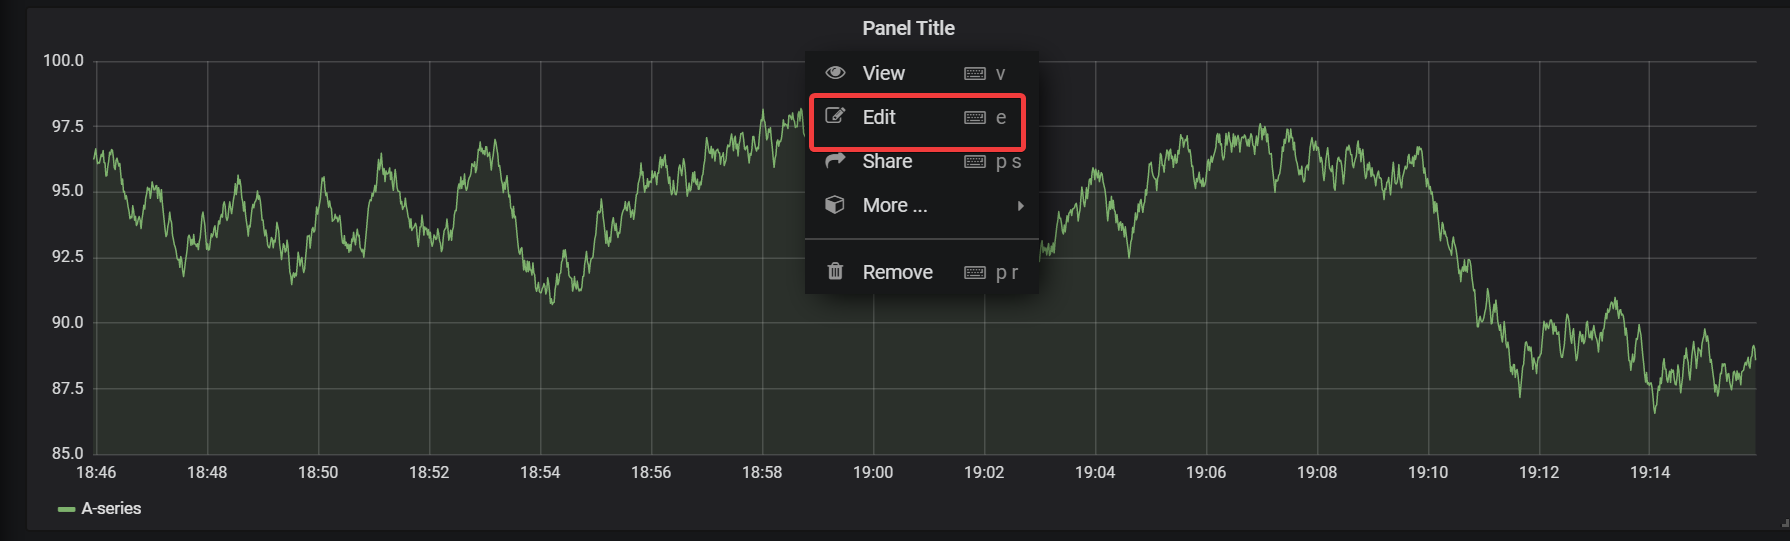
2.Click on the small drop-down button near “Panel Title” and click on “Edit” button
3.Modify “Query A” as per the requirement - Capture CPU utilization
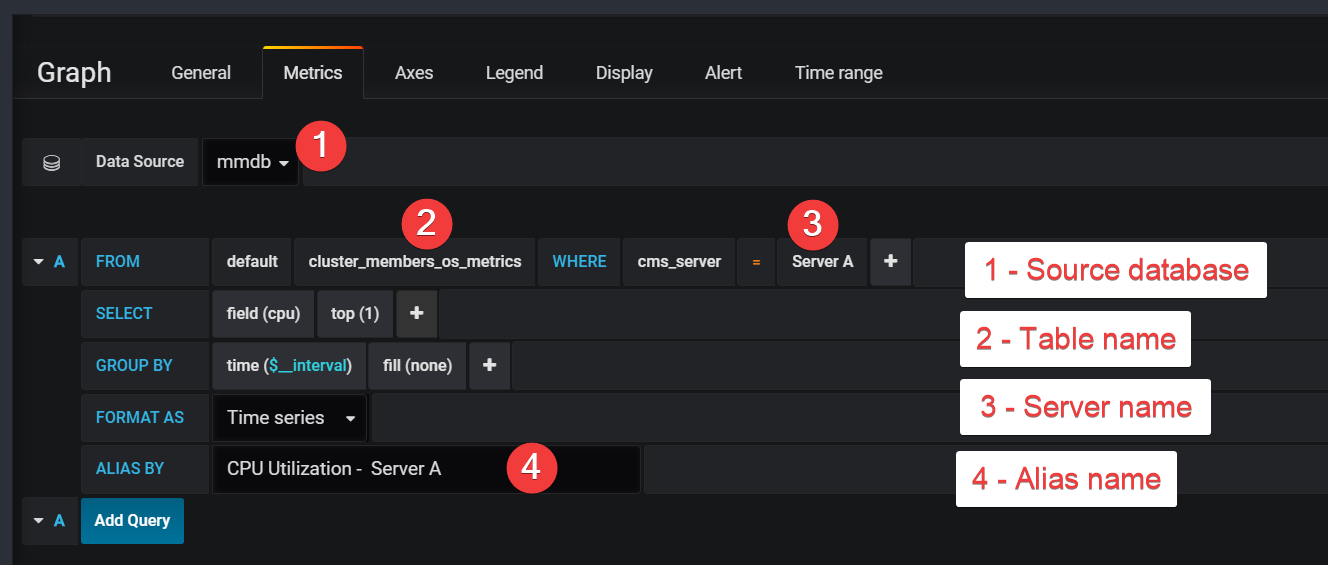
The above is the query to fetch CPU percent usage from the MM database
Note
In the above query, Server A is the hard coded entry of server name where as using template variable like "Environment" is not supported here
4.Go to “Alert” tab and configure the required threshold

5.Click on “Test Rule” to evaluate the current state of the alert
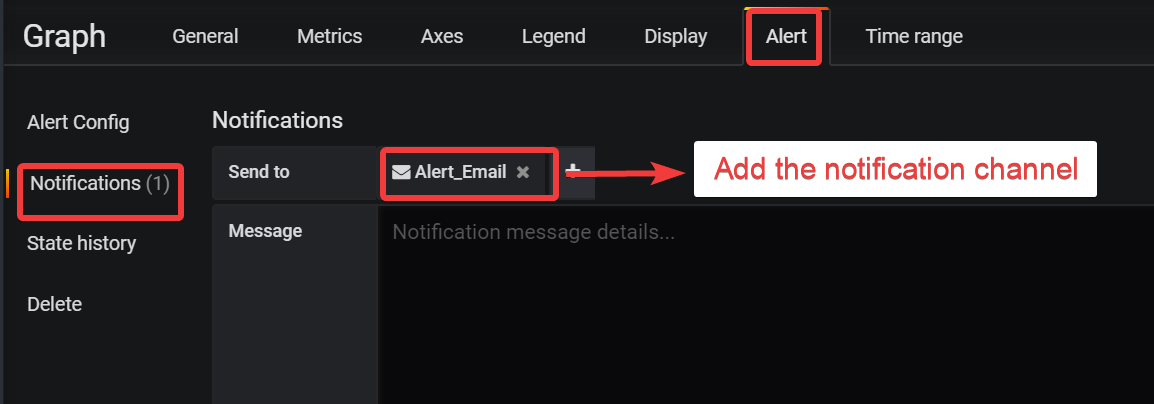
6.Click on “Notifications” and tag the notification channel
7.The “State History” button keeps the last 50 state change alerts
8.Then finally save your dashboard for the changes to come into effect
In the same way, create an individual panel graphs for each server and configure alerts accordingly
Important
The option to add all server names in a single panel graph is not giving expected results at this point hence individual graphs are needed for each server respectively
NOTE:
Example of an alert scenario
 Alert is configured to run every 1 minute starting 10 AM

At 10:00 AM, conditions met - > Alert triggered(state changed to true)
At 10:01 AM, conditions met - > Alert won’t be triggered(state remains true)
At 10:02 AM, conditions met - > Alert won’t be triggered(state remains true)
At 10:03 AM, conditions met - > Alert won’t be triggered(state remains true)
At 10:04 AM, conditions met - > Alert won’t be triggered(state remains true)
At 10:05 AM, conditions not met -> Alert triggered(state changed to false)
At 10.06 AM, conditions met – Alert triggered(state changed to true)
Alerts will be triggered if and only the alert condition changes its state and won't be triggered if a condition retains its previous state(true/false)