Tree Views of Compared Targets
This is the main area of the Visualization View in Visual Diff. It consists of two major blocks, left and right, which represent two selected targets:
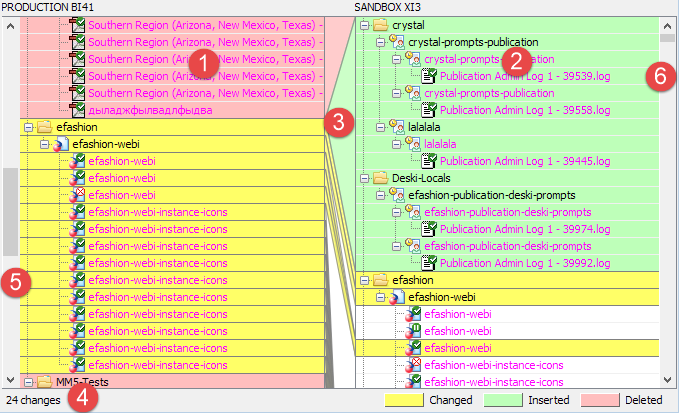
In those areas, the BI data under selected targets is displayed, as two tree structures.
Each node in those tree structures is marked with one of the following background colors:
Color |
Status |
Matching |
||||
White |
No change |
Matches 100% |
||||
Yellow |
Changed |
Matches >0%, <100% Nodes in this status have additional command(s) available on the context menu:
|
||||
Green |
Inserted |
Exists in this target, completely missing in another |
||||
Red |
deleted |
Missing in this target, inserted in another |
Each node in the left area ![]() is linked with some place in the tree of the right area
is linked with some place in the tree of the right area ![]() , and vice versa. Those links are displayed as lines
, and vice versa. Those links are displayed as lines ![]() between the areas.
between the areas.
There is a counter of changes found which is located at the bottom of the View ![]() .
.
There are two scroll bars: one for the left area ![]() , another for the right one
, another for the right one ![]() . If the Sync scrolling option is enabled, then scrolling of any of those two scroll bars causes scrolling of another area too.
. If the Sync scrolling option is enabled, then scrolling of any of those two scroll bars causes scrolling of another area too.
About Sorting
Results (changes found) do not depend on the fact that the first piece was put on the left target and the second piece on the right one, and not in the opposite order. But sorting of the results does depend.
Nodes in the left area are always sorted alphabetically.
Nodes in the right area are sorted to match the left tree and to avoid crossing of link lines.
If you swap targets, white nodes stay white, yellow ones stay yellow, red ones become green, green - red, and sorting changes.